


Money markets estimate a 68% probability of a final 25bp hike to 5.25% in May, but that could quickly revert to reprice a policy pause if we’re treated to a refreshingly soft inflation report. If so, we’d expect the US dollar and yields to move lower whilst gold and Wall Street rise to the occasion. And it’s not impossible given the Fed’s preferred measure of inflation (personal consumption expenditure) was below expectations for March.
Economists expect CPI to soften to a 17-month low of 5.2% and rise just 0.2% m/m, down from 0.4% previously. Yet core CPI (which excludes food and energy) is expected to remain sticky and rise an unwanted 0.4% m/m or 5.6% y/y – more than twice the Fed’s target. And if services inflation remains undesirably high then we could find the US dollar and yields remain bid and gold tracks Wall Street lower.
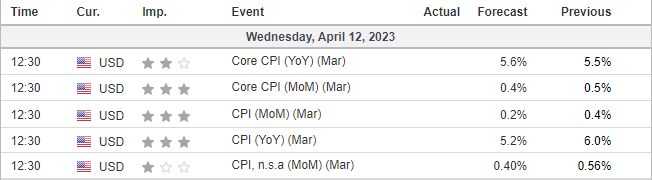
Will US inflation continue to soften?
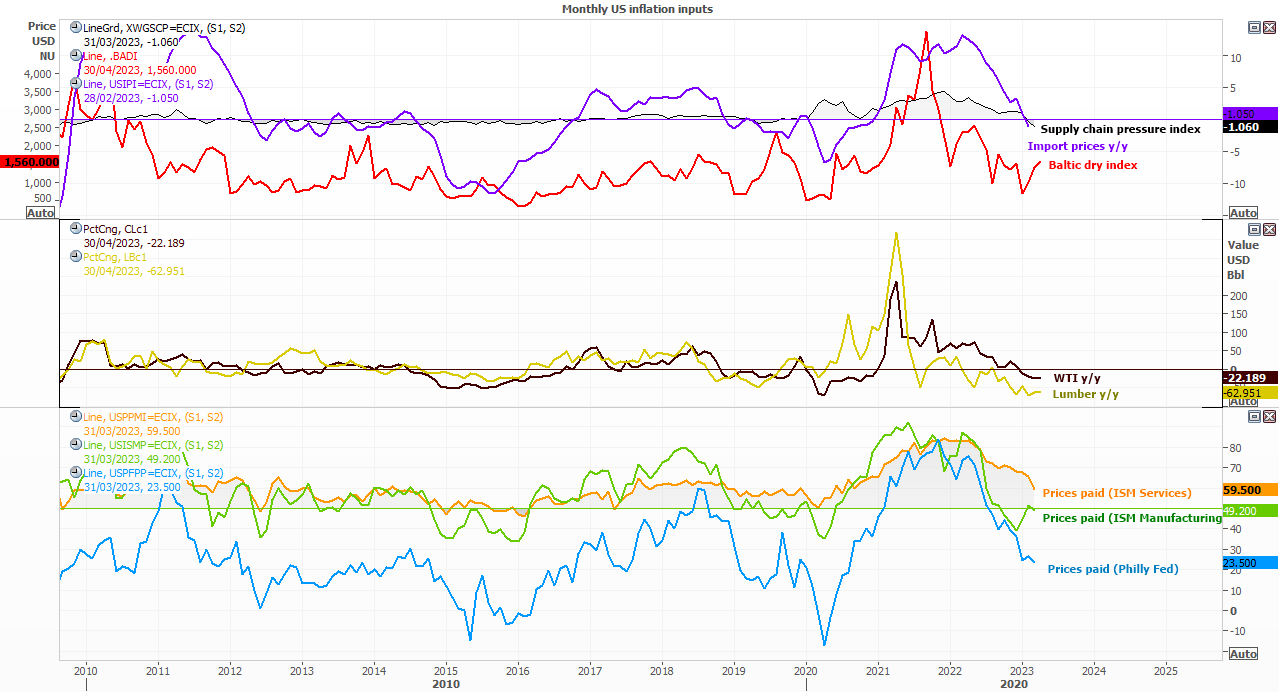
If we look at some key inflationary inputs (which are by no means an exhaustive list), it certainly backs up the call for inflation to cool. WTI and lumber prices have fallen -22% and -63% respectively, prices paid from PMI reports are trending lower with import prices, the supply chain pressure index is negative and the Baltic dry index is down -68% from its 2021 high.
With that said, OPEC’s surprise oil output cut muddied the oily waters by sending prices sharply higher last week, reigniting fears of a second wave of inflation. And if that arrives then cuts look very unlikely this year. But this is an evolving theme, and one for the back burner heading into today’s CPI print.
Gold prices are rising ahead of today’s inflation report
A rise in geopolitical tensions between China and Taiwan and the North and South Korea are helping gold retain its safe-haven status. But an increasingly inverted yield curve also has investors on edge about a potential recession, not helped by comments from the IMF yesterday. And with expectations for US inflation to continue to soften, it has weighed on the US dollar and helped send gold to a 3-day high.
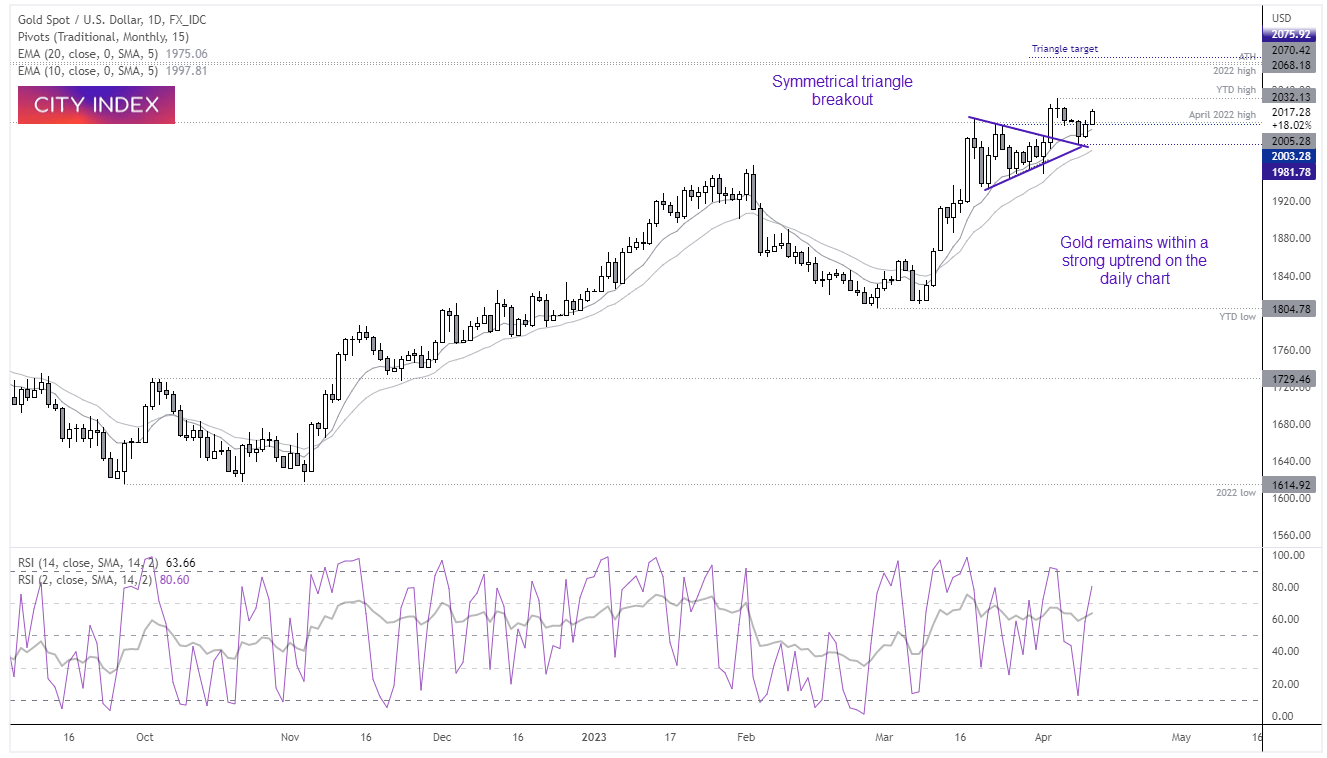
Gold remains within an established uptrend on the daily chart. It has broken out of a symmetrical triangle which projects a target just above the all-time highs around $2075, and a recent pullback respected the triangle’s upper trendline.
If gold can rally up to $2075 we doubt it will simply break to a fresh record high, given its historical significance and likelihood that some will want to pocket some profits around the key milestone. But a rise in geopolitical tensions, weak dollar and yields could eventually see the metal yellow reach $2100 and beyond.
- A soft inflation print could send gold prices above $2032 to mark a fresh YTD high, given the inverted yield curve, talks of soft growth and rise of geopolitical tensions across parts of Asia. And this could clear a run for the 2022 / ATH and symmetrical triangle target.
- The bias remains bullish above the 2003 low (but we can use just below 2000 as an invalidation point for a more conservative approach).
- Bulls could then seek bullish setups above this level with the view to increase the potential reward to risk ratio should prices pull back from current levels.
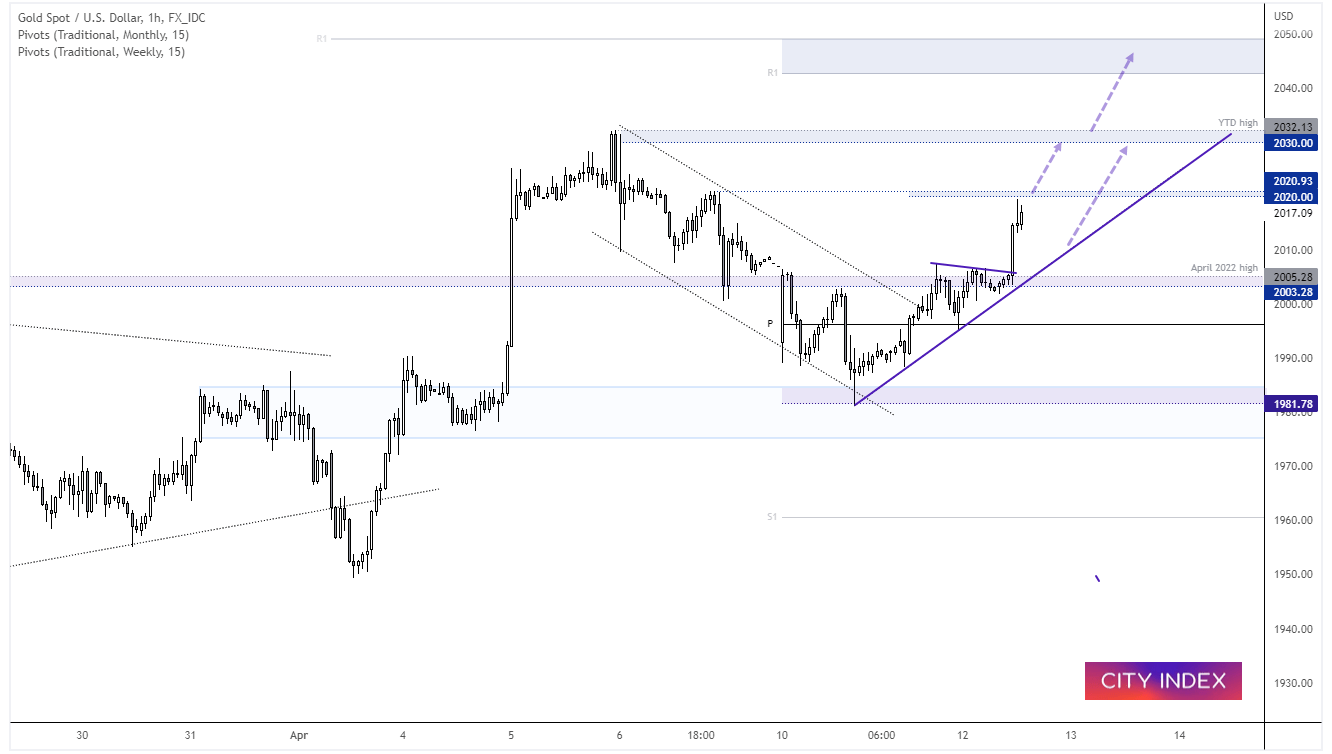
Gold 1-hour chart:
Gold sprang higher in the Asian session on comments by Fed member Kashkari’s. He warned that the US could enter a recession due to a slowdown of lending following a collapse of several banks, and the potential for weaker economic data.
The 1-hour chart shows prices accelerated away from trend support and are close to testing out $2020 target outlined in yesterday’s European Open report. Volatility is likely to be on the quieter side as we head towards the inflation report, and 2020 could act as a pivotal level.
- Due to the strong trend structure, we prefer to seek bullish setups above trend support, with a break above 2021 assuming a run for the YTD highs around 2030.
- A break above this level then brings the 2043 – 2050 range into focus, based on the weekly and monthly R1 pivots.
- And break below 2000 invalidates the bullish bias.
-- Written by Matt Simpson
Follow Matt on Twitter @cLeverEdge
How to trade with City Index
You can trade with City Index by following these four easy steps:
-
Open an account, or log in if you’re already a customer
• Open an account in the UK
• Open an account in Australia
• Open an account in Singapore
- Search for the market you want to trade in our award-winning platform
- Choose your position and size, and your stop and limit levels
- Place the trade
Latest market news
Today 08:33 AM
Latest Trade Ideas articles


Yesterday 11:48 PM