Gold eases as equities oil jump trend still bullish
The price of gold is easing back at the time of this writing as safe haven assets take a back seat with stocks rallying and […]
The price of gold is easing back at the time of this writing as safe haven assets take a back seat with stocks rallying and […]
The price of gold is easing back at the time of this writing as safe haven assets take a back seat with stocks rallying and the dollar rebounding slightly. Other commodities were mostly higher, with crude oil extending its advance for the third day after a surprise drawdown in US crude stocks and another fall in production further boosted expectations of a tighter oil market later in the year. Despite today’s weakness tough, gold is still holding up relatively well following its upsurge in the first quarter of this year. The metal could benefit if the equity markets start to pullback once again, as has been the trend in recent days, or if the dollar weakens once more, which is certainly possible given the lack of any fresh stimulus behind today’s USD rally. Furthermore, the oil market rally could provide support for commodities across the board, from which both gold and silver could benefit. It is also not unheard of for both gold and equities to rise in tandem. So just because it is not rising now, it doesn’t mean the outlook for gold has turned bearish – not yet, anyway.
Strong physical demand: WGC
Indeed, the physical demand for gold is healthy. In the first quarter of 2016, the gold price upsurge was supported by strong physical demand, above all for investment purposes according to the World Gold Council. The WGC estimates that global gold demand jumped by a good 21% year-over-year, which is the highest first quarter figure recorded and also the second best quarter ever. Demand for gold-backed ETFs, bars and coins swelled by more than 120 per cent as investors fretted about the stock markets and as global central banks turned more dovish which further boosted the appeal of non-interest-bearing precious metals. Central banks remained net purchasers of gold for the 21st consecutive quarter. But demand in Asia, especially for jewellery, was subdued in Q1.
However, jewellery demand, particularly in India, should rise during the monsoon season later in the year. This could help to keep gold prices supported should investment demand ease back. The People’s Bank of China and Central Bank of Russia are the biggest purchasers of gold. However at 2.2% of its total reserves, the PBOC’s gold holdings are still relatively low. If the PBOC continues to expand its gold reserves, this source of support will also help the price of the precious metal.
Technical outlook
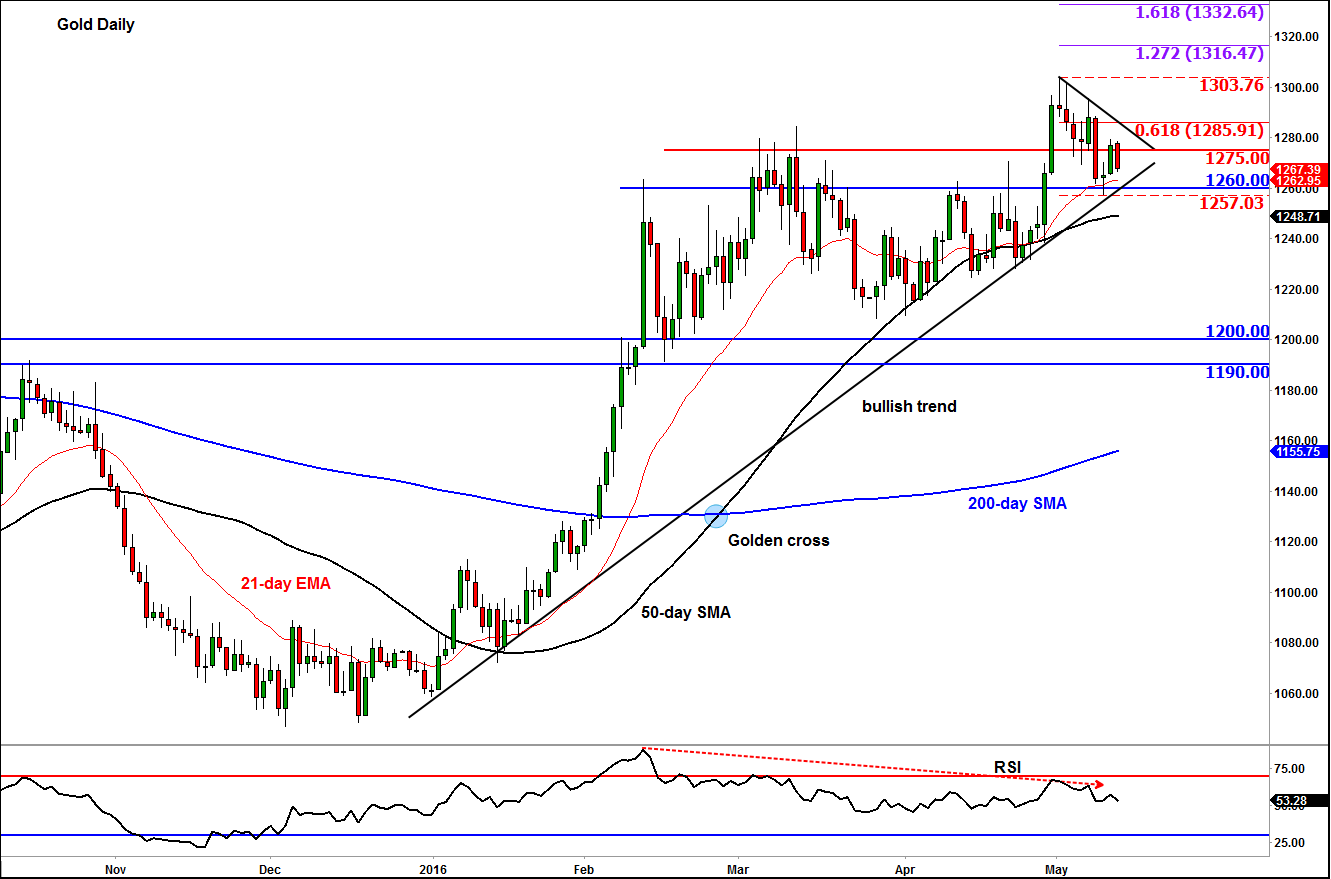
For now, gold maintains its general upward trend as all the major moving averages are pointing higher on the daily chart. Gold’s consolidation near the trend highs also shows strength rather than weakness, for if the latter was the case the metal “should” have dropped by now given the extent of the rally in Q1. The consolidation near the highs has allowed the RSI to unwind from severely “overbought” levels of 70 and above through time rather than price. With the RSI still holding above 40, the momentum is still bullish though a little weaker than in the past. The short-term bullish bias could become invalid however if gold were to break below this week’s earlier lows of around $1257/60 area. In this case, at least a retest of the 50-day moving average would then become highly likely.
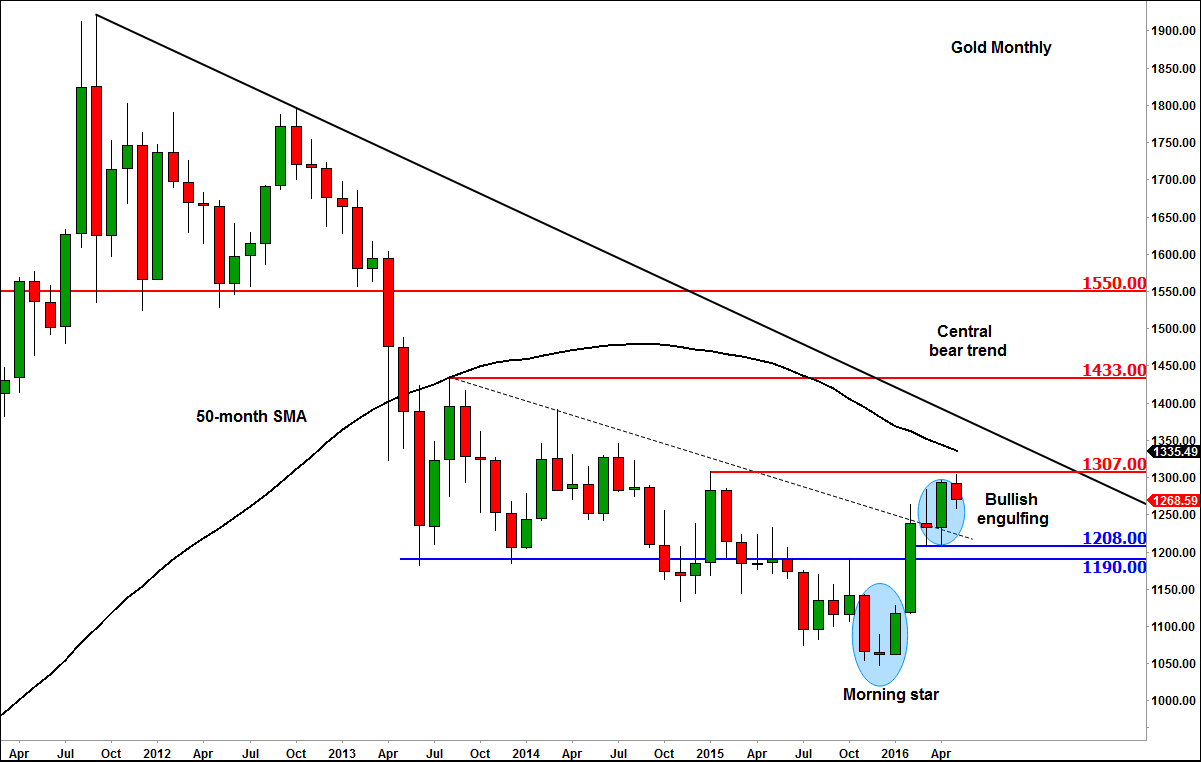
However, the longer term technical outlook remains pretty much bullish. As the monthly chart shows, gold’s rare morning star reversal formation was followed by a period of consolidation above the key long-term resistance at $1190. Last month, gold formed a bullish engulfing candle, which more than erased the small loss it had suffered in March. This month’s candle is currently red, but a decisive break above the prior reference point of $1307 still looks the more likely outcome than a break back below the $1190 key support. If it does rise above $1307 then the bulls may aim for the 50-month SMA at $1335 next, followed by the central bearish trend line slightly higher. Conversely, a break below $1190 would become likely should the lows from the prior two candles around $1208 break down. This would obviously be a bearish outcome.