Precious metals started the new trading week and month lower yesterday after falling in the last two weeks of April. Both metals were trading lower again at the time of this writing; gold was trading around $1255 and silver $16.80 per troy ounce. During the last couple of weeks of April, the Dollar Index also fell, chiefly due to a sharp rally in the EUR/USD and GBP/USD currency pairs. The euro rose on the back of a market-friendly outcome of the French first round elections, while the pound strengthened after the UK Prime Minister Teresa May called a snap general election. So, the Dollar Index’s weakness in the past couple of weeks or so hasn’t been because of the greenback itself. If anything, the US dollar has risen sharply against the Japanese yen and commodity currencies. Thus, gold’s weakness cannot be entirely due the US dollar, because the latter has been trading mixed. Therefore, it must be due to the on-going “risk-on” trade, with US and some European equity markets being at or near record high levels. This has reduced the appeal of safe haven gold. But as we start to move towards the summer months, equity markets may become less buoyant due above all to seasonality factors. This could underpin safe haven assets like gold and silver. In the very near-term, Wednesday’s policy statement from the Fed and then the US monthly jobs report on Friday should provide the next catalyst for gold.
Given the recent weakness, we are now on the lookout for bullish price patterns to emerge on the charts of gold and silver, while on the indices we are watching for bearish price patterns to potentially unfold, although both scenarios need not line up this way for gold to make a comeback. At the moment though, there isn’t a lot that can be said about gold though we do think that the long-term price action since the end of 2015 has been bullish. We also like the fact that the long-term 55-week moving average is now trending higher while the 200-week moving average has flattened and is no longer falling. The moving averages tell us objectively that the long-term trend is no longer bearish. However, gold is yet to break down its long-term bearish trend line, which again held in early April. As a result, we have seen a sharp unwinding of the long positions that had been accumulated since December 2016 and again in March.
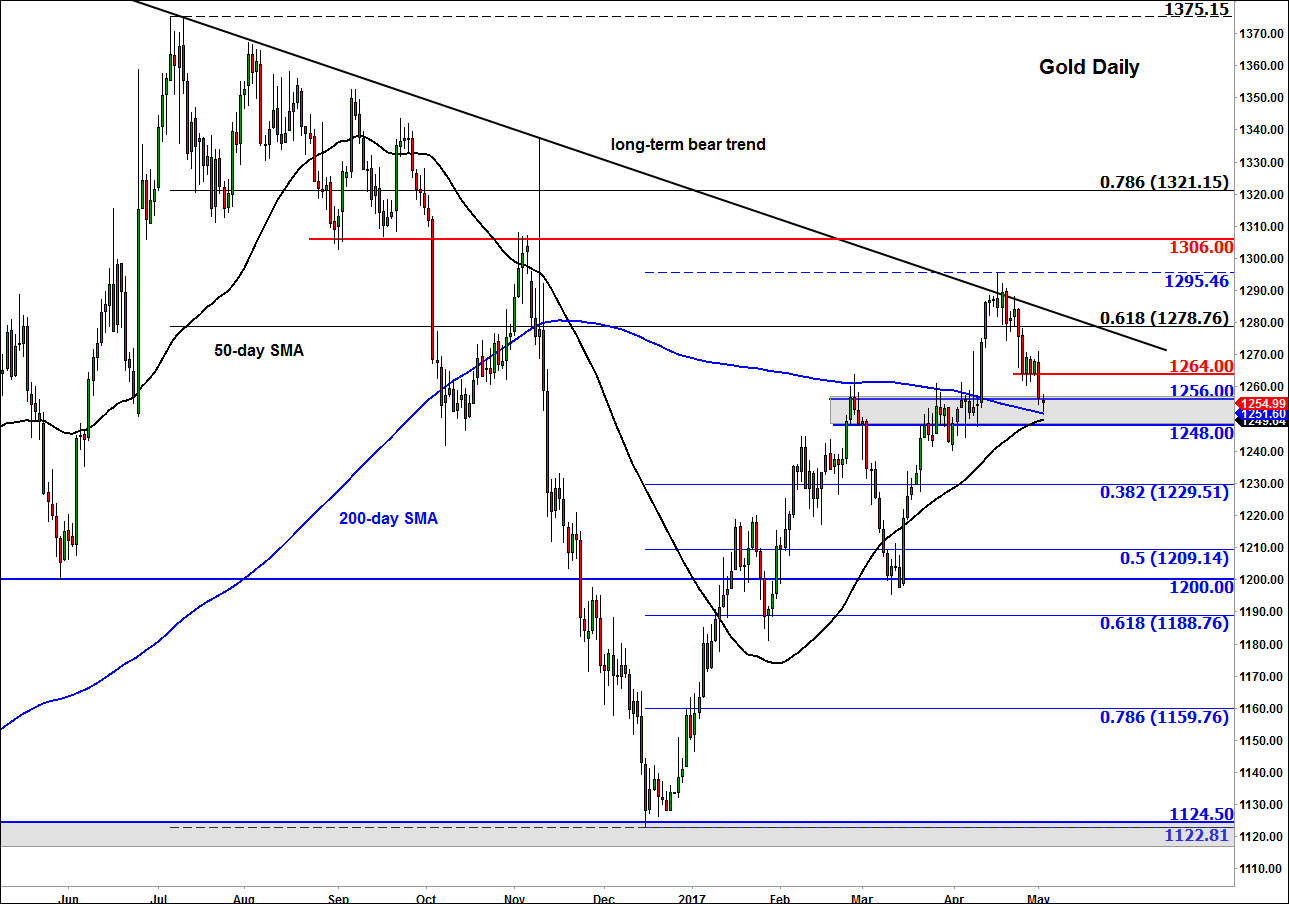
But as can be seen on the daily chart of gold, the precious metal has entered a key support region between $1248 and $1256. This area was previously resistance, so it may turn into support now that it is being re-tested. In addition, both the 50- and 200-day moving averages come into play here. A reversal-looking daily candlestick price patterns here is what the bulls are hoping to see here. The bears meanwhile will need to see a swift break down. If that were to happen then we may see some further follow-up technical selling towards the support and/or Fibonacci levels shown on the chart, starting at $1229/30 (38.2%).
Latest market news
Today 11:14 AM
Today 08:28 AM
Yesterday 03:30 PM