


September 6, 2022 5:05 AM
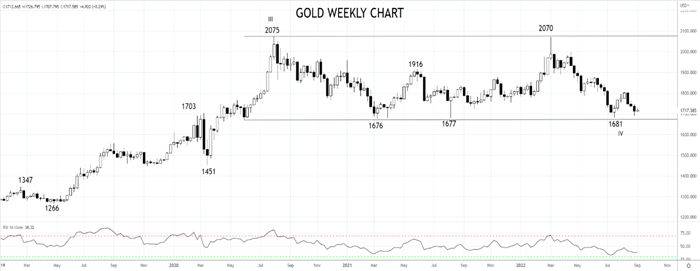
Gold has spent the past two- and a-bit years trading in a wide range between $1670 and $2070.
In our last update on gold two weeks ago here, we noted that gold was again edging towards the bottom of the range, and should gold hold and begin to bounce from this support zone, longs should be considered.
Gold undone again by the rampant U.S dollar post-Jackson Hole
The fallout from the Fed Chairs Hawkish speech at Jackson Hole (amongst other things) was enough to push gold to a low late last week at $1688. A move that coincided with the U.S dollar index, the DXY, breaking to fresh record highs and briefly above 110 last night.
As noted previously, gold is typically inversely correlated to the U.S dollar. When the U.S dollar rallies, gold generally declines and vice versa.
What about yields?
While gold sometimes has a negative correlation with real yields, including into the end of last year and during the first half of 2022, it’s a correlation that weakened after Q1 2022.
Interestingly the expectation of rate hikes into Q1 2023, reinforced by Fed Chair Powell at Jackson Hole, has not been enough to drive gold through its range lows.
Instead, the expectation of lower rates and a softer U.S dollar by mid-2023 is possibly providing some support for the beleaguered precious metal and its ability to hold range lows.
What about positioning?
The Commitment of Traders report shows that long open interest in gold amongst the non-commercial speculative traders (mainly trend following accounts) has been whittled down to 117k from 274k contracts in March of this year.
What do the charts say?
Based on the tentative rebound from ahead of the support zone provided by range lows $1680/70, we are cautiously bullish gold, looking for a rebound back towards $1807, with scope to the middle of the range at $1870.
On the downside, a break and close below $1670/60 would negate the bullish bias and open up the next downside levels at $1557 and then $1451.
Source Tradingview. The figures stated are as of Sept 6th, 2022. Past performance is not a reliable indicator of future performance. This report does not contain and is not to be taken as containing any financial product advice or financial product recommendation
How to trade with City Index
You can trade with City Index by following these four easy steps:
-
Open an account, or log in if you’re already a customer
• Open an account in the UK
• Open an account in Australia
• Open an account in Singapore
- Search for the company you want to trade in our award-winning platform
- Choose your position and size, and your stop and limit levels
- Place the trade
Latest market news
Today 08:28 AM
Yesterday 03:30 PM
Yesterday 01:23 PM
Yesterday 11:00 AM
Yesterday 08:15 AM
Latest Gold articles
April 1, 2024 01:09 PM
March 28, 2024 10:30 AM
March 26, 2024 11:24 PM
March 26, 2024 12:00 PM