


GBP/USD takeaways
- The pound has shrugged off dovish comments from BOE member Tenreyo while soft JOLTS data is leading to selling in the dollar.
- The US ADP report and NFP on Friday will have a big impact on the greenback’s price action ahead of the holiday weekend.
- For GBP/USD, a sustained breakout above 1.2450 would open the door for continued strength toward 1.2650 or 1.2750.
Heading into today, FX traders were expecting relatively quiet trade ahead of some key economic data releases through the middle of the week and a long holiday weekend.
Instead, we’ve seen an outbreak of volatility, with GBP/USD at its epicenter.
East of the Atlantic, the biggest news was ostensibly bearish for GBP/USD, with BOE member Silvana Tenreyro stating that the central bank may need to cut interest rates sooner than expected. That said, the market has essentially shrugged off those headlines given Dr. Tenreyo’s well-earned reputation as one of the BOE’s leading doves.
Meanwhile, the US release of the JOLTS job openings report provided a shock. Job openings fell by more than 500K to below 10M for the first time since August 2021. This report provides a sign that the labor market may be loosening ahead of the higher-tier ADP and NFP employment reports expected later this week.
All told, traders have been selling the greenback aggressively during today’s US session, with the pound generally holding steady against its major rivals after a big rally in the Asian session.
Pound technical analysis: GBP/USD daily chart
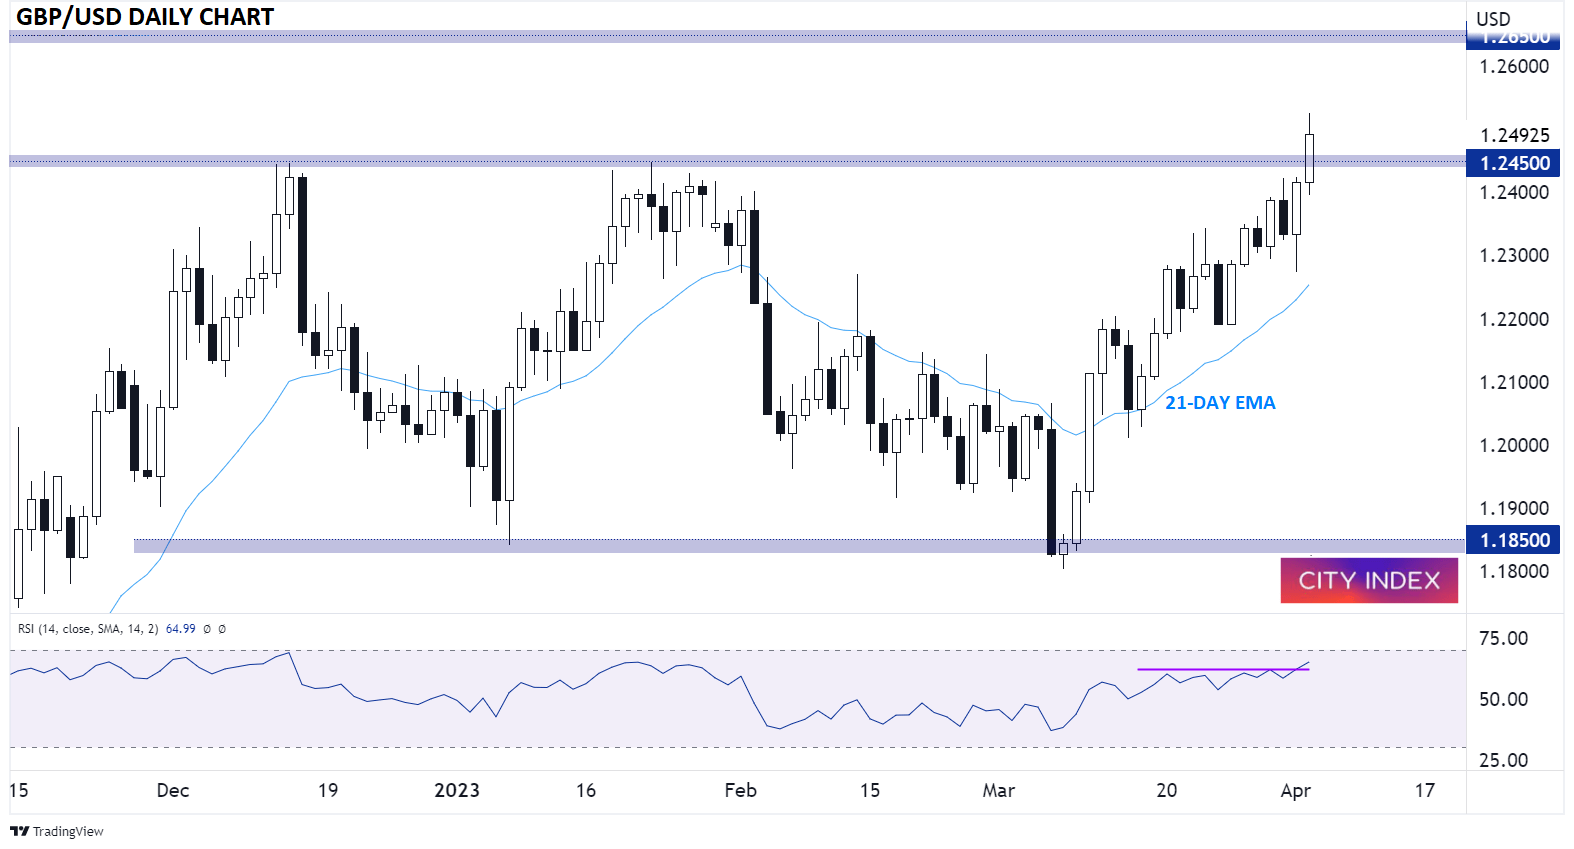
Source: StoneX, TradingView.
As the chart above shows, GBP/USD has broken out above strong previous resistance in the 1.2450 area to hit a fresh 10-month high today. At the same time, we’ve seen the pair’s 14-day RSI indicator rally to its own highest level in months.
If this breakout holds throughout the rest of the week, it would signal that the longer-term trend has shifted back in favor of the bulls, opening the door for a continuation toward previous resistance at 1.2650 or the 61.8% Fibonacci retracement of last year’s swoon near 1.2750 (not shown) next.
Only a break back below 1.2450 would signal a potential “failed breakout” and erase the current bullish bias.
-- Written by Matt Weller, Global Head of Research
Follow Matt on Twitter @MWellerFX
How to trade with City Index
You can trade with City Index by following these four easy steps:
-
Open an account, or log in if you’re already a customer
• Open an account in the UK
• Open an account in Australia
• Open an account in Singapore
- Search for the market you want to trade in our award-winning platform
- Choose your position and size, and your stop and limit levels
- Place the trade
Latest market news
Today 11:14 AM
Today 08:28 AM
Yesterday 03:30 PM
Latest GBP articles
April 3, 2024 02:49 AM
March 29, 2024 10:00 PM
March 9, 2024 04:00 PM
October 24, 2023 02:20 AM