GBP technical analysis against USD JPY and EUR
The GBP/USD has finally found some support today, though it is too early to say whether the selling pressure is over just yet. There hasn’t […]
The GBP/USD has finally found some support today, though it is too early to say whether the selling pressure is over just yet. There hasn’t […]
The GBP/USD has finally found some support today, though it is too early to say whether the selling pressure is over just yet. There hasn’t been any real news out to support the pound. If anything, news out of the UK has been actually bearish. For example, a survey of 100 business leaders by accountancy firm KPMG has shown that the vast majority would consider moving their headquarters or operations outside Britain due to Brexit. So the GBP/USD’s slight improvement could just be a case of short-covering, supported further by the fact that the dollar has sold off more than the pound today with EUR/USD also rallying and USD/JPY falling back below 100.30. Indeed, the GBP/JPY is actually trading lower, while the EUR/GBP is higher, though both are off their extreme levels. Thus, at this stage there is no real evidence that the pound is catching a bid. However, that could change as sterling has reached some key levels against its main rivals.
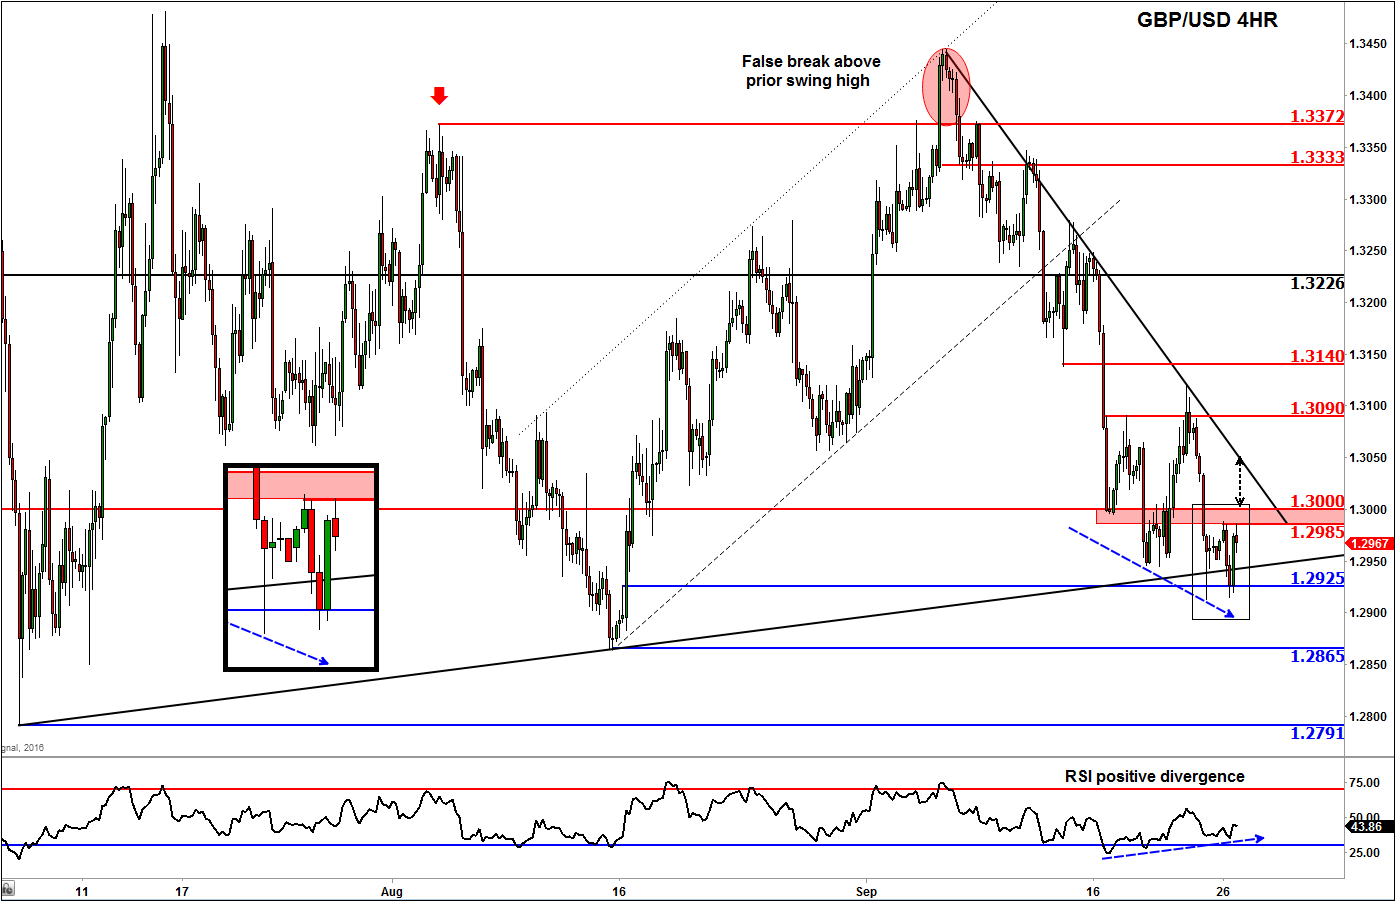
GBP/USD
Against the dollar, the GBP has found support at around 1.2925, a level which was support in the past. The RSI momentum indicator has also created a positive divergence with price (higher low vs. lower low in the Cable), suggesting that the downward pressure may be weakening. The GBP/USD has now managed to climb back above its bullish trend line that has been in place since a low of 1.2791 was hit post the Brexit vote. This is a bullish development in the short term outlook. If the GBP/USD were to climb back above the 1.2985/1.3000 resistance area now then it may go for another test of the bearish trend line, before possibly breaking further higher. However all bets will be off if today’s low is breached later on or tomorrow. Some of the key levels of support and resistance are shown on the chart, in blue and red respectively.
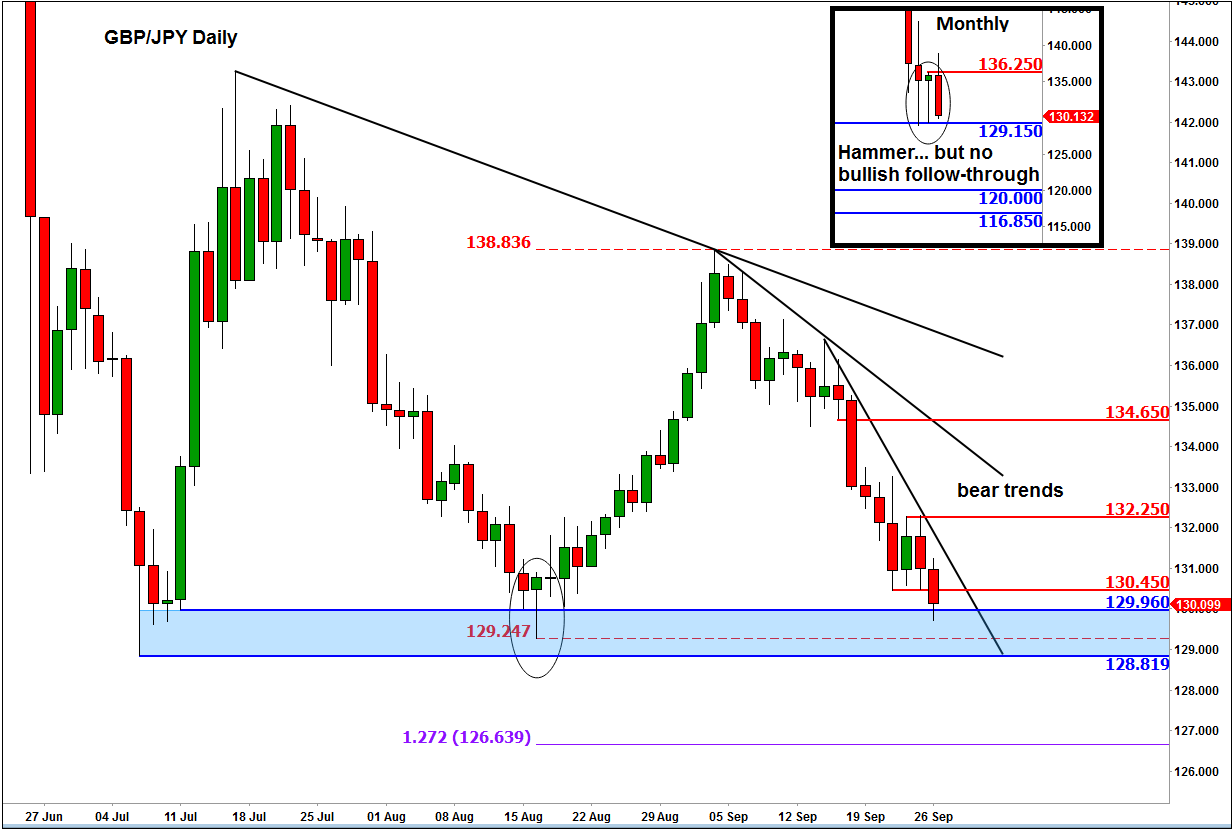
GBP/JPY
Like the Cable, the GBP/JPY has approached the lower end of its recent range, testing the key 128.82-129.96 support zone. Last month, the GBP/JPY had bounced strongly off this area which resulted in the formation of a hammer candlestick pattern on the monthly chart. However there was no follow-through at the start of this month and now the monthly chart shows a large red candle as a result of the bullish no-show. But for as long as the low from August at 129.25 is not breached, there is still a slim chance that we may have already seen a low for this pair. It should be noted that if support gives way here then we could see the onset of fresh selling pressure, potentially towards the next psychological level of 125.00.
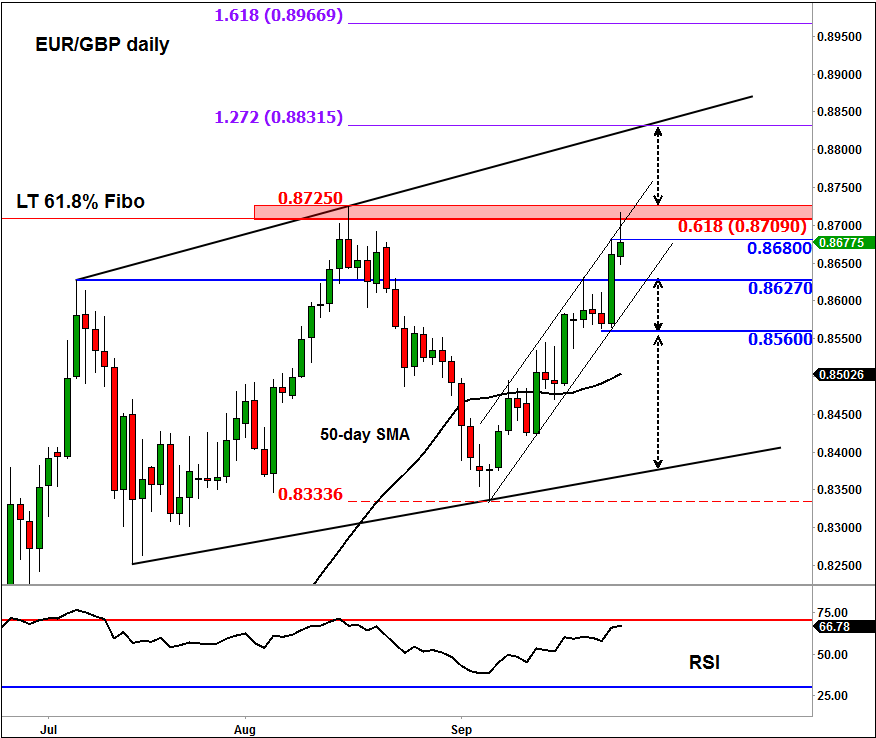
EUR/GBP
Last but not least, the EUR/GBP has reached the top of its recent range where it is also facing the 61.8% Fibonacci retracement against the all-time high (0.8710). On Friday, the EUR/GBP more or less rendered the potential Head & Shoulders formation invalid with a sharp rally that caused price to create a bullish engulfing candlestick formation on the daily chart. But at the time of this writing, the EUR/GBP is struggling to hold above Friday’s high of 0.8680. So, watch for a potential failure here. If the next key support at 0.8625/30 area gives way then expect to see a larger pullback. Conversely, if the high from August at 0.8725 is breached on a closing basis first, then there is little further resistance to watch until the 2013 high of 0.8815. Slightly above this level is the 127.2% Fibonacci extension level of the downswing from August, at 0.8830.