


UK banks are set to report Q1 results for 2023 over the coming days. Here are the dates below:
Standard Chartered -Wednesday 26th April
Barclays – Thursday 27th April
NatWest – Friday 28th April
HSBC – 2nd May
Lloyds – 3rd May
What to watch:
Q1 results come just weeks after the banking crisis, which resulted in the collapse of two US banks and UBS’s takeover of Credit Suisse. With this in mind, inflows and outflows of deposits will be a good measure of confidence in each bank as cracks appeared in the system across those three weeks in March.
UK banks are not expected to see as large fluctuations as banks in Europe and the US; any changes could still provide clues over how investors perceive each institution. Deposit inflows are most likely given that these banks are considered high-quality safe banks.
Net Interest Income
If US banks are anything to go by, then net interest income (NII) could provide a strong boost to banks’ financial performance in Q1. The Bank of England and the Federal Reserve base hiked interest rates across the first three months of the year, helping the likes of JP Morgan and Bank of America post strong NII, which is likely to be replicated in UK bank results.
Bad debt provisions
As concerns rise over the outlook for the economy, bad loan provisions have also been on the rise. In Q2 2022, bad debt provisions rose and could be raised further if banks are fretting over a recession. Should bad loan provisions rise, this could offset gains from NII and NIM. Expectations are for Barclays to set aside £563 million in Q1 for bad loan provisions and NatWest £250 million.
Investment banking
Barclays, HSBC and Standard Chartered are more impacted by investment banking activities than Lloyds and NatWest. Q1 has been a challenging backdrop for investment banking activities which will mean that advisory fees may have been hard to come by. Fixed income and equity trading could also come in lower than Q1 2022.
Banks reporting this week:
Barclays
Pre-tax profit is forecast to rise to £2.30 billion.
Rising interest rates are expected to benefit the traditional banking arm. Still, given that the bank is less reliant on interest income, it won’t enjoy as much of the benefit of higher base rates compared to some of its sector peers. In its trading division, fixed income faces a tough comparison from last year, when it generated 20% of group revenue. FICC is expected to see an 11% decline YoY. Meanwhile, uncertainty in the economic outlook means that it is already anticipating a higher level for bad loans and dealmaking, which its investment arm relies on, is expected to remain muted.
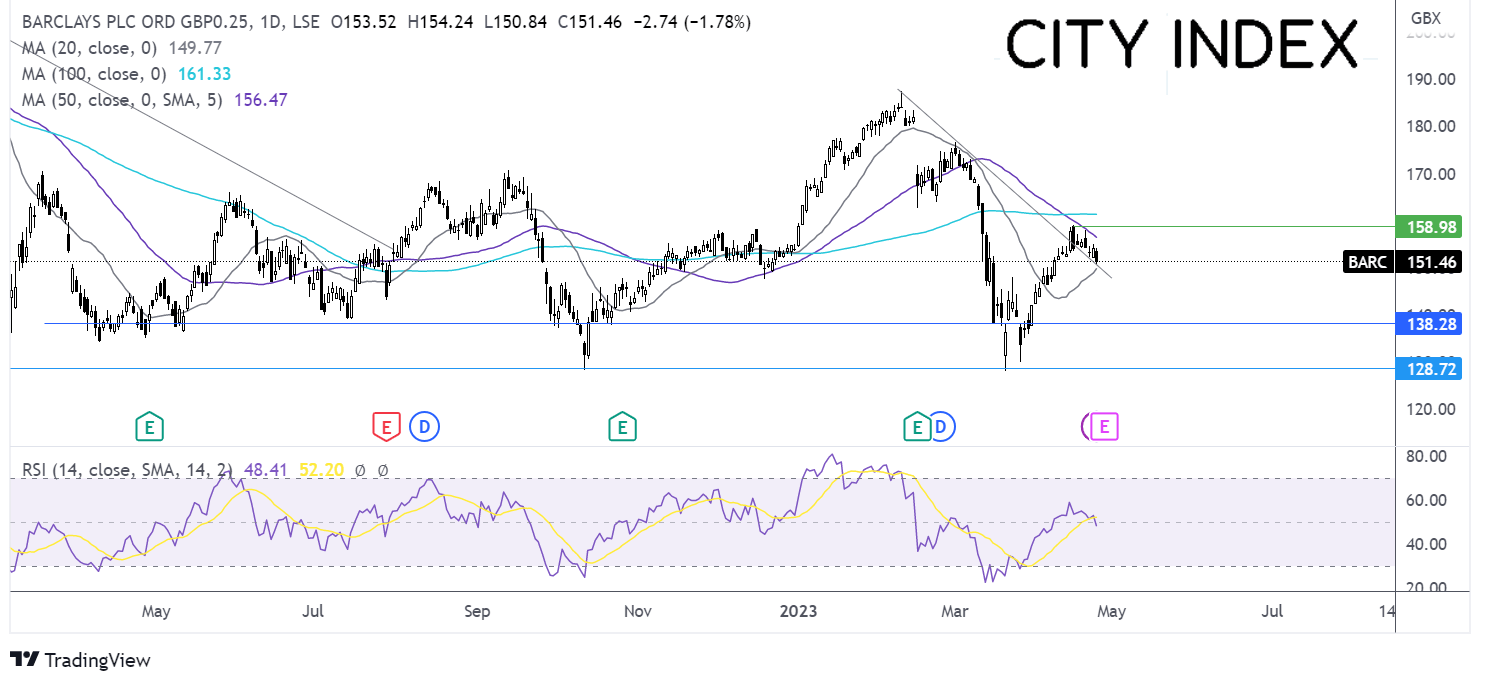
Where next for the Barclays share price?
Barclays ran into resistance at 159p, the 50 sma, and eased lower. The price is currently testing the falling trendline resistance and the 200 sma at 150p -149p zone. The RSI hints toward further losses.
Sellers could look for a fall below the 200 sma to open the door to 138p the March 15 low and 128p the 2023 low.
Should buyers successfully defend the 200 sma, then bulls could look for a rise above the 50 sma at 156p and 160p the April high.
NatWest
Expectations are for EPS to rise 18% YoY to 11.61p and for revenue to rise almost 25% YoY to £3.78 billion. In February, the bank has guided for net interest margin of 3.2%, although analysts at Citigroup and Barclays believe that they could do better. NatWest could surprise to the upside is credit losses, which are expected at £259 million, come in lower than feared. However, the bank could up its buffers if there are early signs of customer defaults.
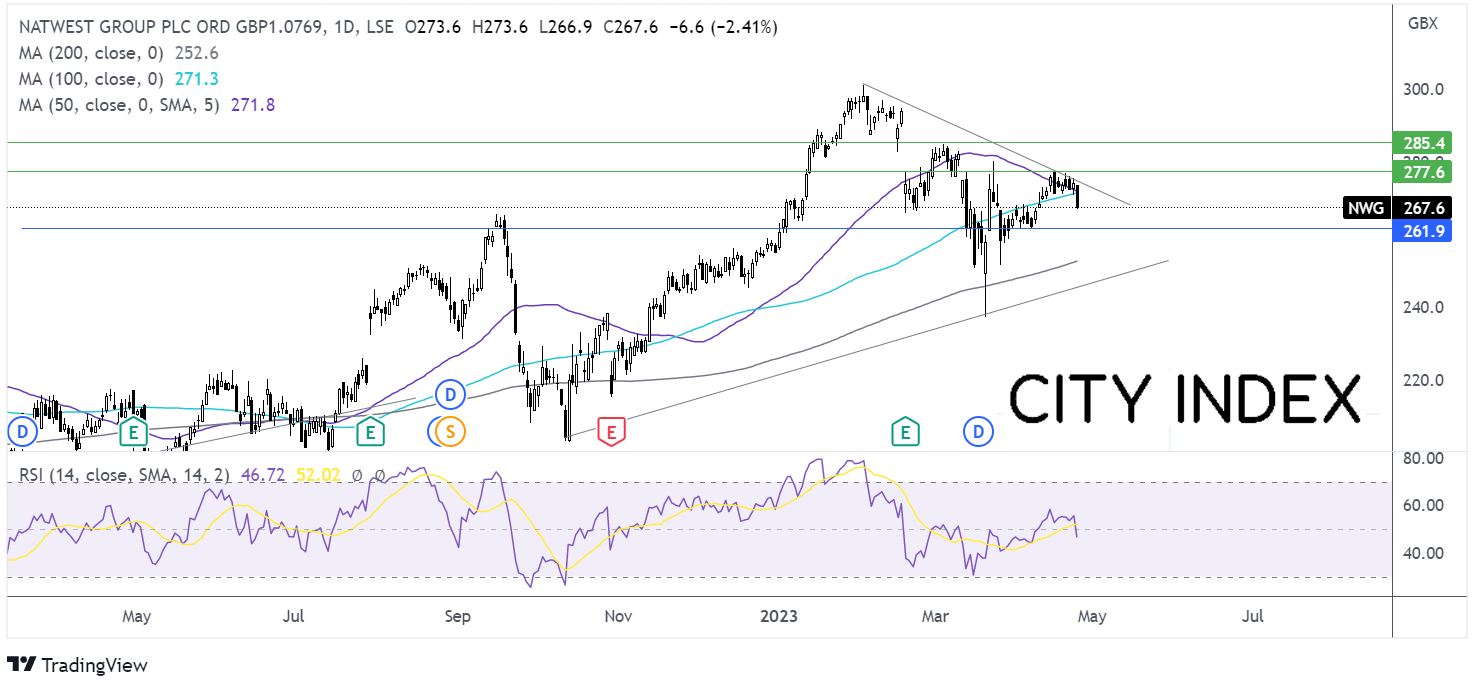
Where next for the NatWest share price?
After running into resistance on the falling trendline, the price has dropped lower, falling below the 50 & 100 sma, which, combined with the RSI below 50 keeps sellers hopeful of further losses.
Support can be seen at 261p the April low, with a break below here exposing the 200 sma at 252p, also the March low.
On the flip side, buyers need to retake the 50 & 100 sma at 271p in order to test the falling trendline resistance at 274p. A rise above here brings 276p, the April high into play.
Latest market news
Today 08:15 AM
Latest Banks articles
October 23, 2023 09:25 AM
October 13, 2023 12:45 PM
October 6, 2023 02:28 PM
July 21, 2023 01:38 PM