


Short-term technical outlook on Russell 2000/US Small Cap 2000 (Fri 24 May)
click to enlarge charts
Key technical elements
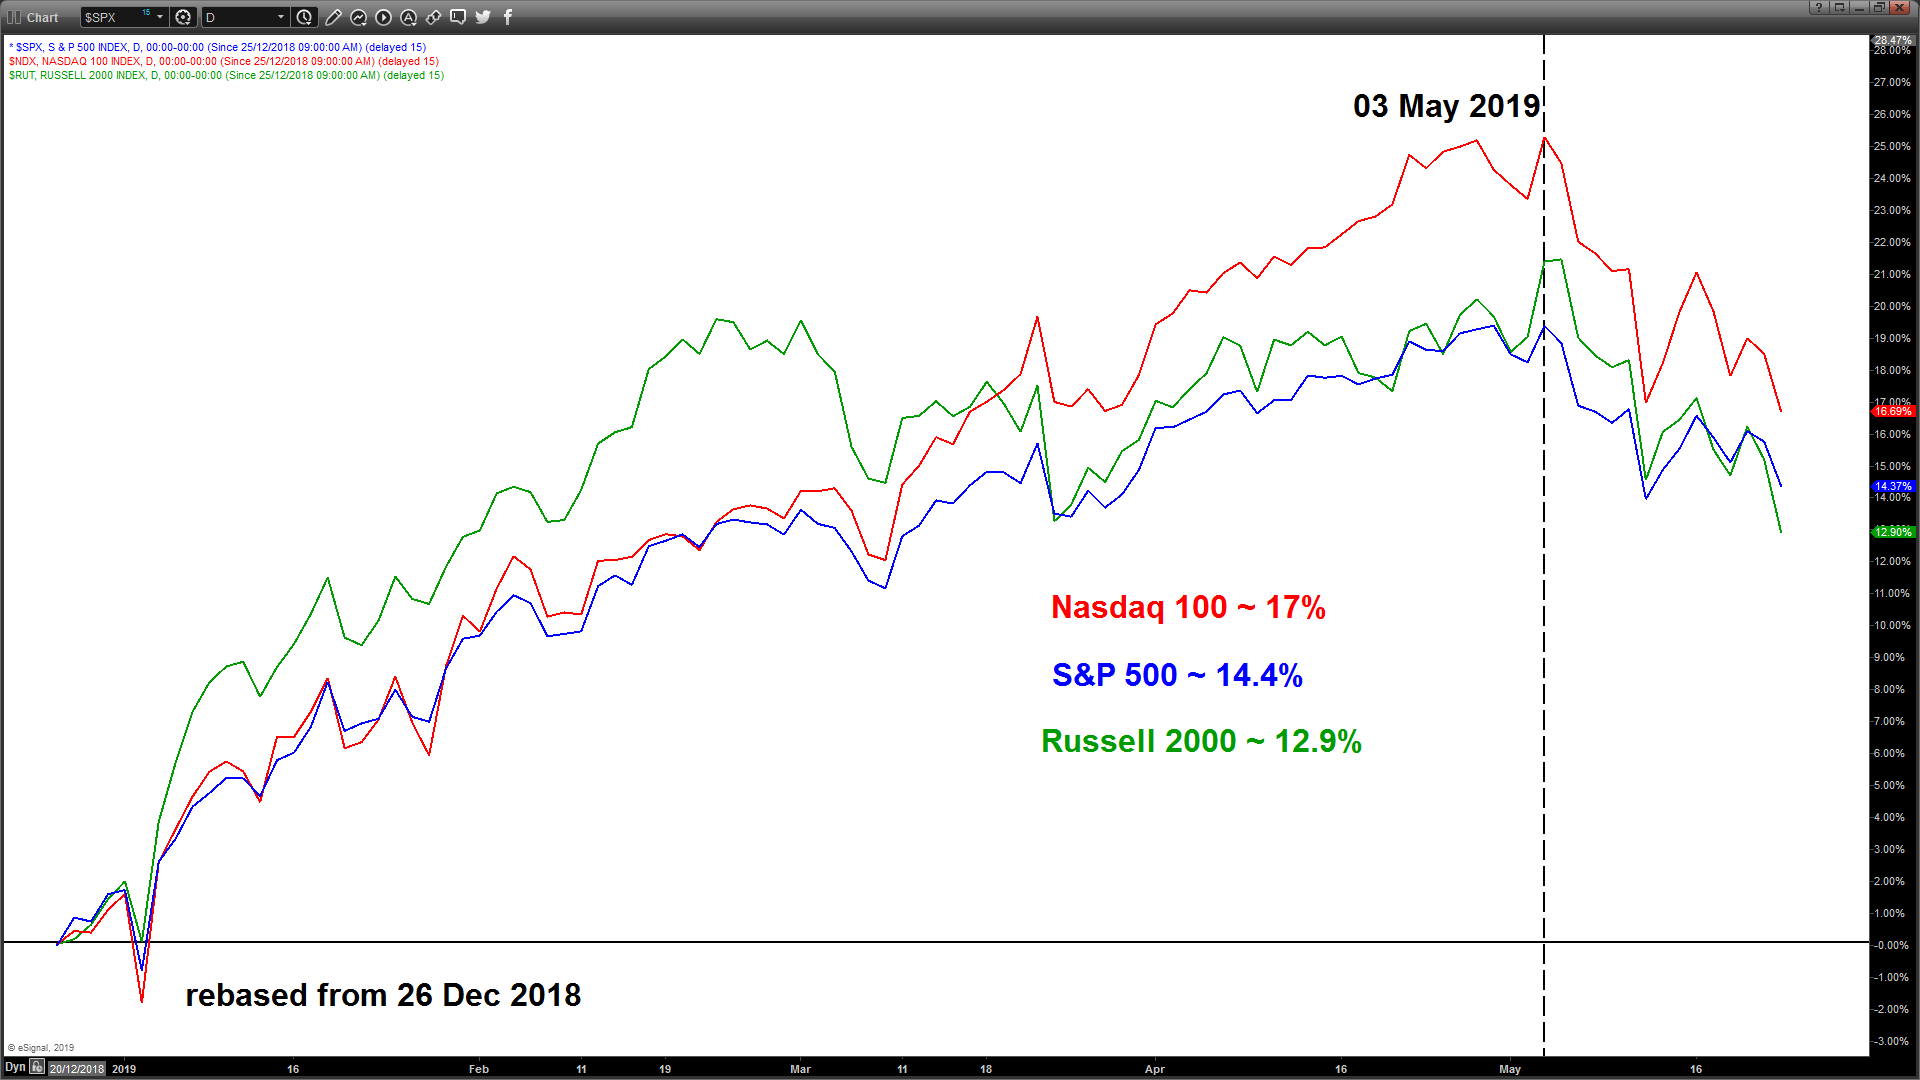
- The Russell 2000 remains the underperformer among the major U.S. benchmark stock indices since 26 Dec 2018 where global stock markets have recovered from its horrendous performance seen in Q4 2018.
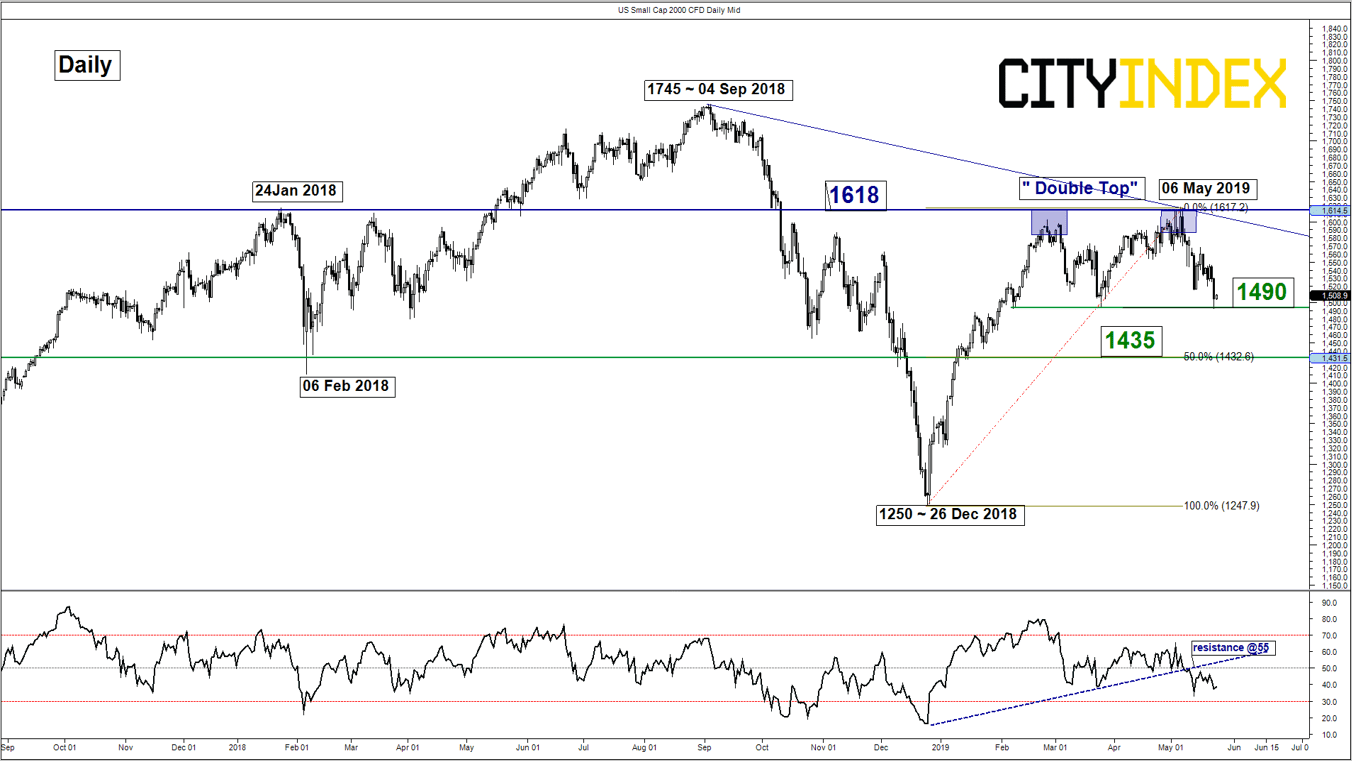
- Since hitting its current year to date high of 1618 on 06 May 2019, the US Small Cap 2000 Index (proxy for the Russell 2000 futures) has staged a 3-week decline of 7.9% to print a low of 1492 as seen in yesterday, 23 May. Current price action of the Index has formed a bearish “Double Top” configuration with a rejection of the 1618 key medium-term resistance.
- The neckline support of the “Double Top” rests at 1490 with medium-term momentum remains negative. The daily RSI oscillator has remained below a significant corresponding resistance at the 55 level and still has not reached an extreme oversold level at 19.
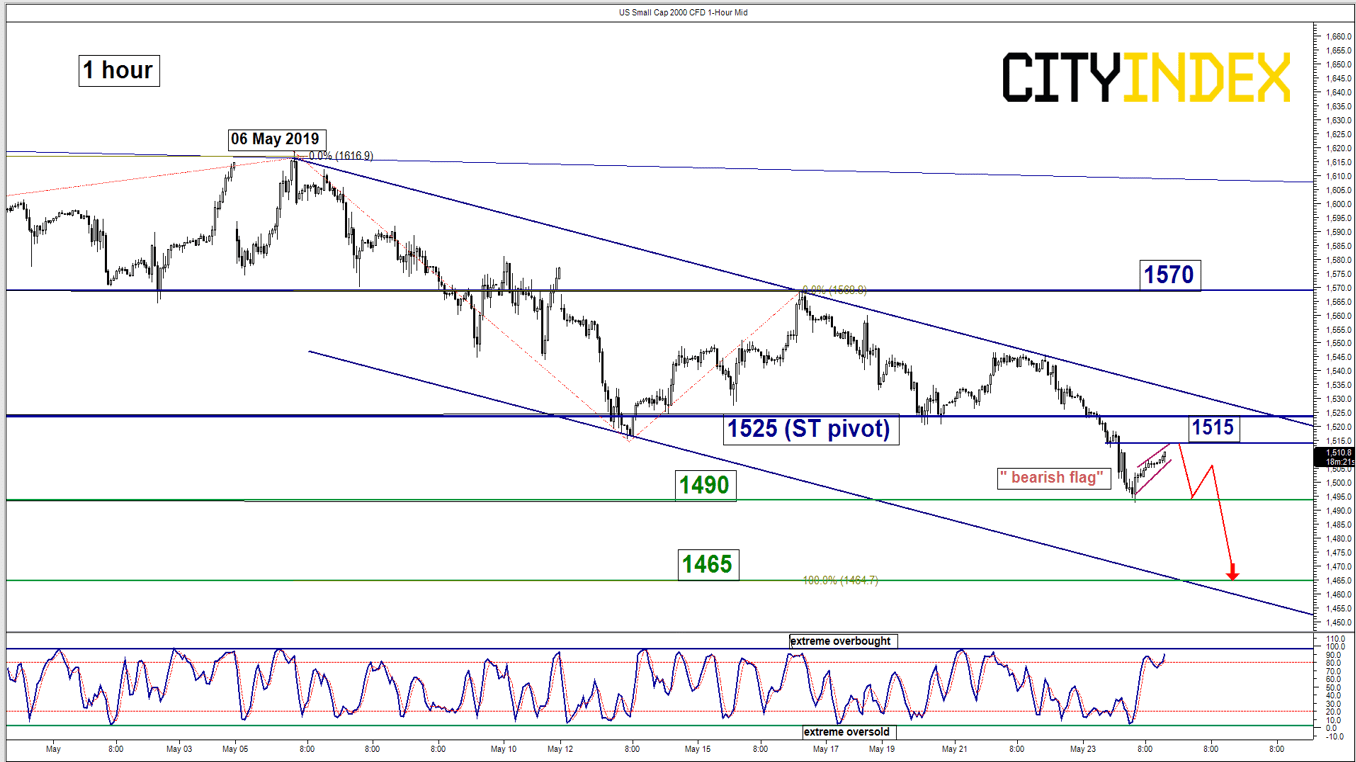
- In the shorter-term, it has evolved within a minor descending channel since 06 May 2019 and the current rebound seen from yesterday, 23 May low of 1492 has taken the form a “bearish flag”/range consolidation pattern after a steep minor decline seen in the last 2-days.
- Key short-term resistance stands at 1525 which is defined by the former minor swing low areas of 20/21 May 2019 and the upper boundary of the minor descending channel. The next significant near-term support rests at 1465 which is defined by lower boundary of minor descending channel and the 1.00 Fibonacci expansion of the current down move seen from 06 May 2019 high.
Key Levels (1 to 3 days)
Intermediate resistance: 1515
Pivot (key resistance): 1525
Supports: 1490 & 1465
Next resistance: 1570
Conclusion
Technical elements are highlighting the risk of a bearish breakdown below the key 1490 neckline support of the “Double Top” below the 1525 key short-term pivotal resistance where Index is likely to stage another potential impulsive downleg to target the next support at 1465 in the first step.
However, a clearance with an hourly close above 1525 invalidates the bearish scenario for a corrective rebound to retest 1570 (congestion area formed from 02 May to 16 May 2019).
Charts are from City Index Advantage TraderPro & eSignal
Latest market news
Today 08:18 AM
Yesterday 10:40 PM
Latest Indices articles
April 18, 2024 04:46 PM
April 17, 2024 11:00 AM
April 16, 2024 08:00 PM
April 16, 2024 04:54 PM