


Asian Indices:
- Australia's ASX 200 index rose by 34.4 points (0.52%) and currently trades at 6,647.00
- Japan's Nikkei 225 index has risen by 268.07 points (1.03%) and currently trades at 26,049.74
- Hong Kong's Hang Seng index has risen by 54.25 points (0.25%) and currently trades at 21,884.60
- China's A50 Index has fallen by -51.31 points (-0.34%) and currently trades at 14,900.20
UK and Europe:
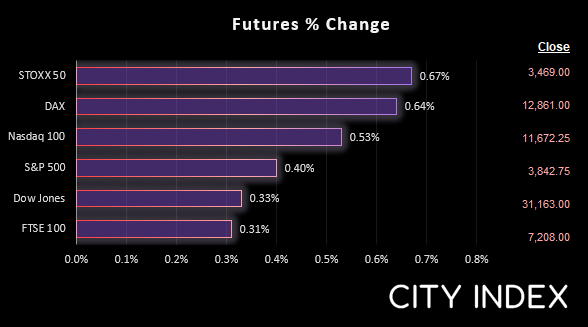
- UK's FTSE 100 futures are currently up 22 points (0.31%), the cash market is currently estimated to open at 7,254.65
- Euro STOXX 50 futures are currently up 23 points (0.67%), the cash market is currently estimated to open at 3,475.42
- Germany's DAX futures are currently up 86 points (0.67%), the cash market is currently estimated to open at 12,859.38
US Futures:
- DJI futures are currently up 105 points (0.34%)
- S&P 500 futures are currently up 64.25 points (0.55%)
- Nasdaq 100 futures are currently up 16 points (0.42%)
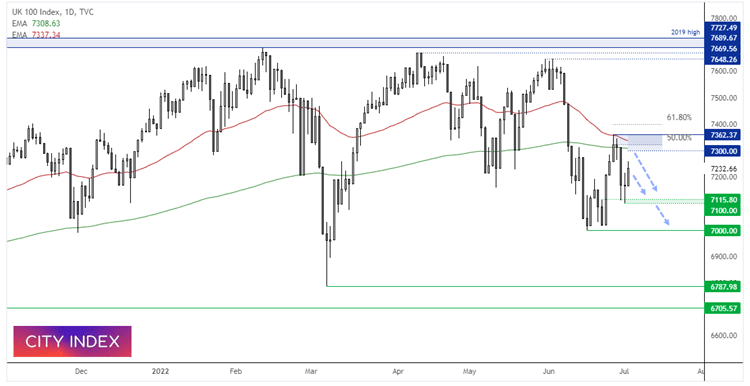
FTSE 100 (Daily Chart):
The FTSE 100 broke above a Doji yesterday, which suggests a swing low is in place at 7100. Yet I’m a little sceptical this rally has legs due to the lack of volume over the past two days. Typically I would prefer to see above-average on a prospective swing low as it suggests a ‘change in hands’ between bulls and bears. Instead, the Doji and yesterday’s bullish candle had below average volume, with yesterday’s volume being the lowest trading volume this year.
Furthermore, 7300 resides overhead and prices remain beneath the 50 and 200-day eMA’s. Therefore I’m keen to explore bearish setups up to this resistance zone in anticipation of a swing high and eventual break beneath 7100.
FTSE 350: 4002.19 (0.89%) 04 July 2022
- 172 (49.14%) stocks advanced and 171 (48.86%) declined
- 6 stocks rose to a new 52-week high, 30 fell to new lows
- 18% of stocks closed above their 200-day average
- 19.43% of stocks closed above their 50-day average
- 3.71% of stocks closed above their 20-day average
Outperformers:
- + 5.20% - Harbour Energy PLC (HBR.L)
- + 4.41% - BP PLC (BP.L)
- + 4.37% - Tullow Oil PLC (TLW.L)
Underperformers:
- -8.32% - Pets at Home Group PLC (PETSP.L)
- -7.70% - Grafton Group PLC (GFTU_u.L)
- -6.99% - Moonpig Group PLC (MOONM.L)
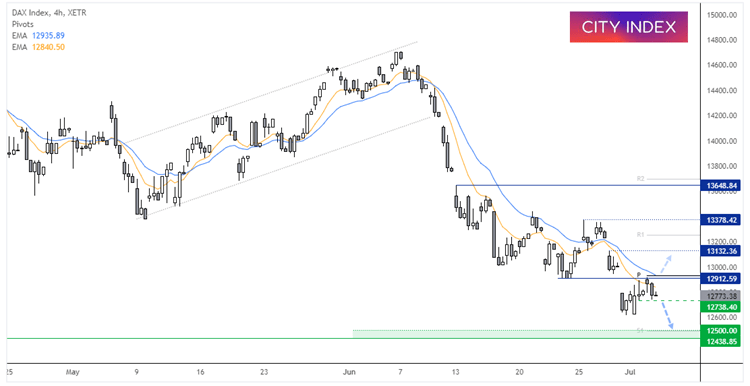
DAX (4-hour chart):
The DAX remains in an established downtrend and was the only major European index to trade lower yesterday. Its initial rally was capped by the weekly pivot point and a swing high has formed around 12,900, below the 20-bar eMA. A break beneath 12,735 assumes bearish continuation and our brings the 12,500 support zone into focus. A break above 12,915 invalidates the bearish bias.
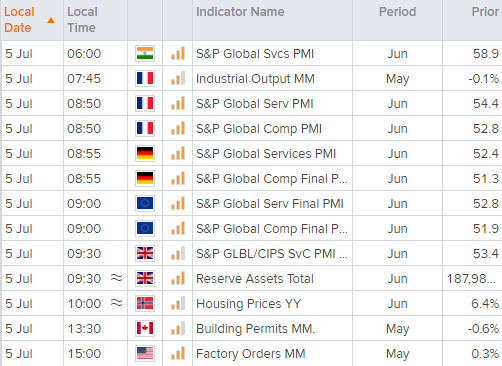
Economic events up next (Times in BST)
Final service and composite PMI’s foe Europe are released this morning. The common theme has been a slowdown in growth for services and manufacturing, and whilst the final reports tend to be the least volatile, they could add further fuel to the bearish fire if they are downwardly revised by a large enough degree. There’s not in the way of US data today despite the end of a 3-day weekend, but it’s possible we can still get some volatility as traders catch up on events missed since Friday.
How to trade with City Index
You can easily trade with City Index by using these four easy steps:
-
Open an account, or log in if you’re already a customer
• Open an account in the UK
• Open an account in Australia
• Open an account in Singapore
- Search for the company you want to trade in our award-winning platform
- Choose your position and size, and your stop and limit levels
- Place the trade
Latest market news
Yesterday 01:23 PM
Yesterday 06:01 AM
April 18, 2024 11:27 PM
April 18, 2024 04:46 PM
Latest FTSE articles
April 10, 2024 08:46 AM
March 27, 2024 09:37 AM
March 18, 2024 09:19 AM
March 13, 2024 08:54 AM