


Asian Indices:
- Australia's ASX 200 index rose by 2.4 points (0.03%) and currently trades at 7,443.40
- Japan's Nikkei 225 index has risen by 501.58 points (1.75%) and currently trades at 29,103.14
- Hong Kong's Hang Seng index has fallen by -115.66 points (-0.44%) and currently trades at 26,016.37
UK and Europe:
- UK's FTSE 100 futures are currently up 5 points (0.07%), the cash market is currently estimated to open at 7,227.82
- Euro STOXX 50 futures are currently up 3 points (0.07%), the cash market is currently estimated to open at 4,191.31
- Germany's DAX futures are currently up 39 points (0.25%), the cash market is currently estimated to open at 15,638.23
US Futures:
- DJI futures are currently up 34.13 points (0.18%)
- S&P 500 futures are currently up 68.75 points (0.44%)
- Nasdaq 100 futures are currently up 10.5 points (0.23%)
Indices
Earning optimism on Wall Street send the Nikkei 225 to the top of the pack, rising around 1.5%. Shares were broadly higher in China on reports that China’s Vice President Liu He had a ‘pragmatic’ call with Treasury Secretary Yellen above macro situations and multilateral cooperation’s. Although property shares were the underperformers on the day.
The DAX close around the highs of a 7-day rage yesterday. Given its strong rally from the 200-day eMA we continue to favour an eventual upside break. It has found support at the 20-day eMA and monthly pivot point, OBV (on balance volume) is confirming higher prices and the A/D line (accumulation/distribution) is testing the August highs which shows net accumulation.
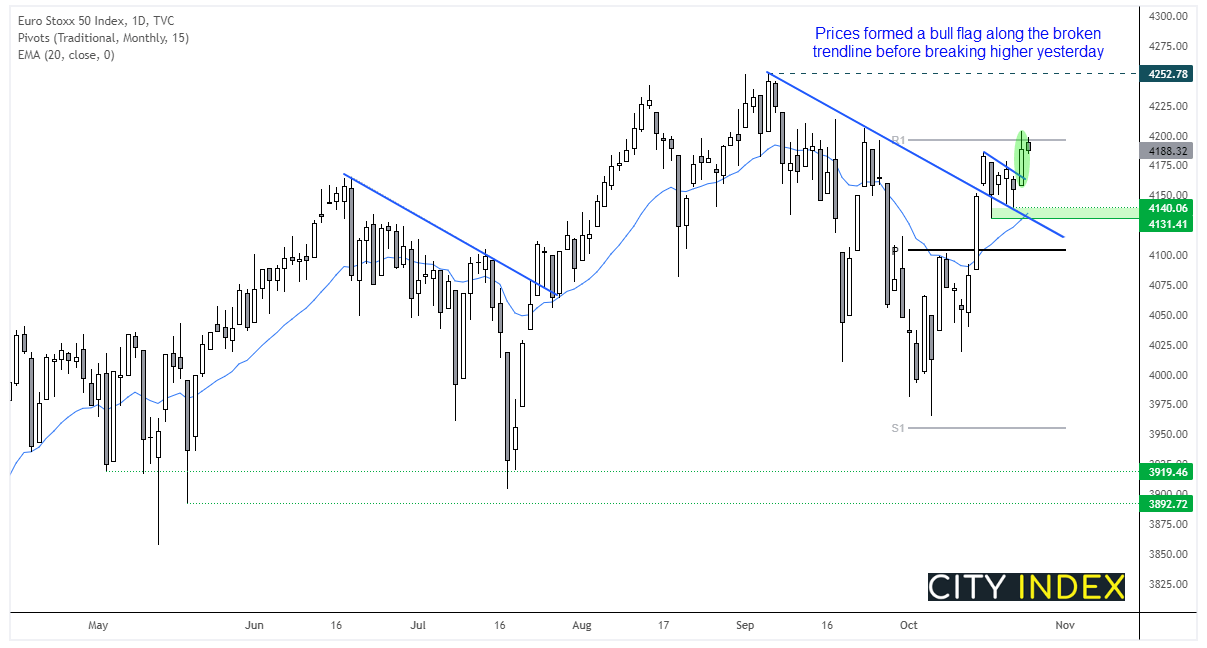
However, the STOXX 50 index appears to be the stronger performer over the near-term as it broke out of a bullish flag yesterday. Like the DAX, it has produced a strong rally from its 200-day eMA, although it didn’t actually test or break beneath it unlike the DAX. It also broke above a descending retracement line then found support above it to form a flag. Furthermore, the A/D line of volume hit a record high last week ahead of price action to suggests bull are accumulating. We are therefore seeking a break above yesterday’s high and the monthly R1 pivot to assume bullish continuation towards its record high.
FTSE 350: Market Internals
FTSE 350: 4135.35 (0.25%) 25 October 2021
- 173 (49.29%) stocks advanced and 158 (45.01%) declined
- 7 stocks rose to a new 52-week high, 3 fell to new lows
- 56.7% of stocks closed above their 200-day average
- 52.42% of stocks closed above their 50-day average
- 22.22% of stocks closed above their 20-day average
Outperformers:
- + 5.19%-Harbour Energy PLC(HBR.L)
- + 4.57%-Ferrexpo PLC(FXPO.L)
- + 3.69%-Energean PLC(ENOG.L)
Underperformers:
- -20.68%-Darktrace PLC(DARK.L)
- -4.02%-Chrysalis Investments Ltd(CHRY.L)
- -3.43%-Caledonia Investments PLC(CLDN.L)
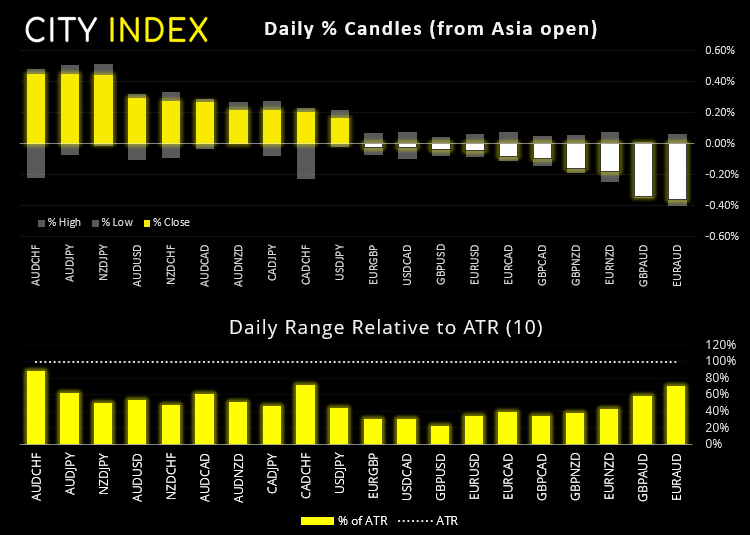
Forex:
South Korean growth missed already deflated forecasts, rising just 0.3% in Q3 compared with 0.6% expected (down from 0.8%) and growth rose 4% y/y, down from 6% previously and below 4.2% expected.
Australian inflation expectations rose to a 7-year high, according to a weekly consumer sentiment report by ANZ. The Australian dollar tracked local yields higher and is currently the strongest major of the Asian session, up around 0.23% and trading above 0.7500. EUR/AUD touched its lowest level since May and AUD/JPY tapped Friday’s high. CPI data for Australia is released tomorrow at 11:30 AEDT.
Commodities:
$85 is in focus for WTI traders today after a bearish hammer initially broke above yet closed below the milestone. Should we see a failed attempt to retest yesterday’s high today it could further suggest oil I due a pullback. Still, with demand rising and oil in shorter supply bears may struggle to take it meaningfully lower, even if its rally is now long in the tooth. Basically, remain nimble.
Brent looks the more convincing one for a breakout as it closed at a 3-year high, but bulls need to break above 86.70 for its trend to continue.
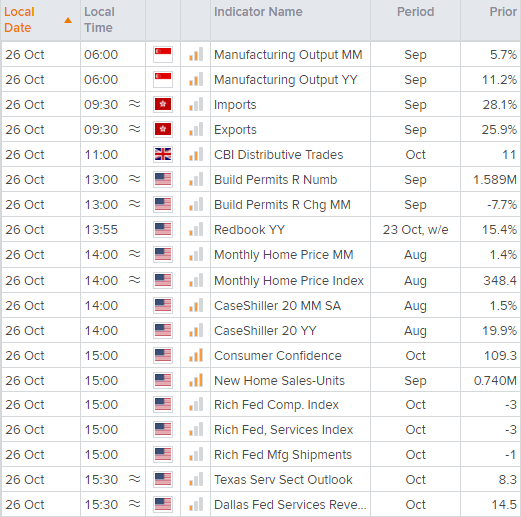
Up Next (Times in BST)
How to trade with City Index
You can trade easily trade with City Index by using these four easy steps:
-
Open an account, or log in if you’re already a customer
• Open an account in the UK
• Open an account in Australia
• Open an account in Singapore
- Search for the company you want to trade in our award-winning platform
- Choose your position and size, and your stop and limit levels
- Place the trade
Latest market news
Today 04:00 PM
Today 01:15 PM
Today 11:30 AM
Today 08:18 AM
Latest Forex articles
Today 04:00 PM

Yesterday 11:30 AM