


Asian Indices:
- Australia's ASX 200 index rose by 11.5 points (0.16%) and currently trades at 7,320.10
- Japan's Nikkei 225 index has fallen by -170.32 points (-0.59%) and currently trades at 28,614.04
- Hong Kong's Hang Seng index has fallen by -128.7 points (-0.45%) and currently trades at 28,181.72
UK and Europe:
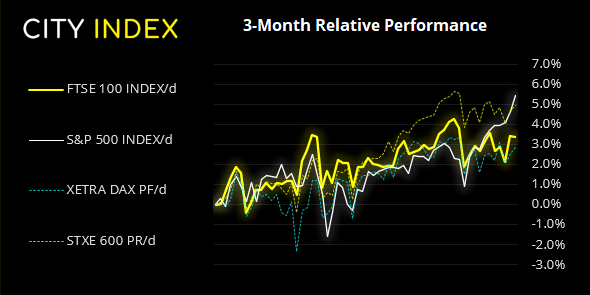
- UK's FTSE 100 futures are currently up 16 points (0.23%), the cash market is currently estimated to open at 7,139.27
- Euro STOXX 50 futures are currently up 3 points (0.07%), the cash market is currently estimated to open at 4,087.31
- Germany's DAX futures are currently up 8 points (0.05%), the cash market is currently estimated to open at 15,658.09
US Futures:
- DJI futures are currently up 152.85 points (0.44%)
- S&P 500 futures are currently down -11.5 points (-0.08%)
- Nasdaq 100 futures are currently down -6 points (-0.14%)
Learn how to trade indices
Indices:
China’s services PMI fell to 50.3 from 55.1, which is quite a significant monthly drop by historical standards. The rise in coronavirus cases in southern China has weighed on the sector, and it now shows the potential to dip below 50 to denote contraction should cases continue to rise this month.
Asian equities were mostly higher as they tracked the strong finish on Wall Street ahead of their 3-day weekend. Japanese shares bucked this trend as rising coronavirus cases weighed on sentiment. BOJ Governor Kuroda reiterated the central bank’s readiness to ease policy further is required to do so, and they’re keeping a close eye on the development of the coronavirus panic. Economic activity is expected to remain beneath its potential for ‘some time’.
After several ups and downs last week the FTSE 100 closed -0.18% last week and was effectively flat on Friday. Losses in the banking sectors offset earlier gains from miners, resulting in a -0.03% los and Doji candle on the daily chart.
The 7095 – 7100 zone is an important area for bulls to defend early in the session. And despite Friday’s reversed gains the hourly trend structure remains bullish whilst prices hold above the 7064.66 low.
The DAX has presented choppy, directional trading conditions over the past two weeks. Until we see a break beneath Wednesday’s 15,461.20 low or Tuesday’s 15752.90 high then range trading strategies are preferred. Within that range, 15,550 – 15,565 is a likely support level as it comprises of the monthly pivot point, Friday’s low and the most actively traded area between Wednesday and Thursday.
FTSE 350: Market Internals
FTSE 350: 4082.3 (-0.03%) 02 July 2021
- 243 (69.23%) stocks advanced and 96 (27.35%) declined
- 23 stocks rose to a new 52-week high, 1 fell to new lows
- 83.19% of stocks closed above their 200-day average
- 54.7% of stocks closed above their 50-day average
- 19.94% of stocks closed above their 20-day average
Outperformers:
- + 6.91% - Watches of Switzerland Group PLC (WOSG.L)
- + 3.80% - GCP Student Living PLC (DIGS.L)
- + 3.53% - 888 Holdings PLC (888.L)
Underperformers:
- -6.59% - AO World PLC (AO.L)
- -5.36% - Micro Focus International PLC (MCRO.L)
- -2.61% - Network International Holdings PLC (NETW.L)
Forex:
The US dollar was the strongest currency overnight and CHF and CAD are currently the weakest currencies. Although with lack of news flow ranges have remained very thin. Main data points today are final PMI reads for Germany, eurozone and the UK. Given that the US is celebrating Independence Day then trading volumes will be lower due to exchanges being closed and, unless we see a catalyst, volatility may also remain on the low side.
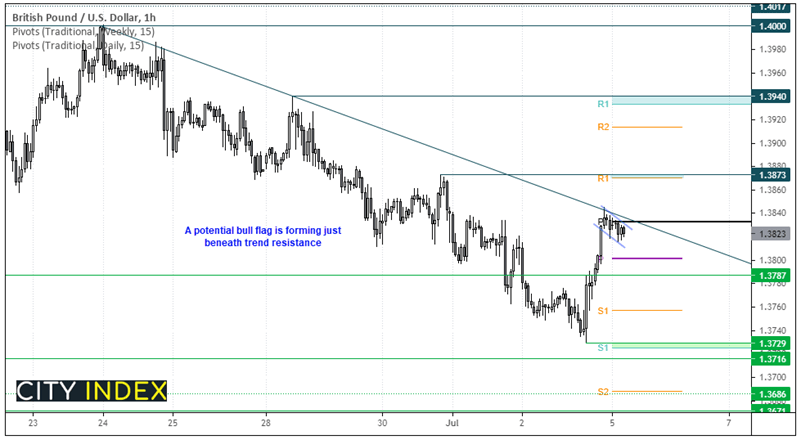
GBP/USD is forming a potential bull flag on the hourly chart to indicate another leg higher. The consolidation is so far remaining beneath trend resistance, but given the sharp bullish reversal seen at Friday’s low we are hopeful bulls can try to take it higher today.
Should prices move initially lower today, we would like to see them hold above the daily pivot near 1.3800 before seeking bullish reversal patterns. A break above the trendline brings the daily R1 level into focus which is just beneath the 1.3873 high.
Learn how to trade forex
Commodities:
Silver prices are trading around Friday’s highs and seemingly headed for $27.00. Unlike gold it has held above its 200-day eMA, although it may face resistance at the 26.70 low which is also where the 200-hour average resides. Given the bullish trend structure on the hourly chart our bias remains bullish above the 25.92 low.
Soybean futures consolidated between Thursday and Friday near the highs of the week, after rallying over 6% from its 50-week eMA on Wednesday. Ultimately, a break above Thursday’s high assumes bullish continuation, and we’d be interested to see any low volatility retracements build a base above 1308’6 – 1400’2. Take note that we will have to wait until tomorrow as the exchange is closed due to Independence Day in the US.
Up Next (Times in BST)
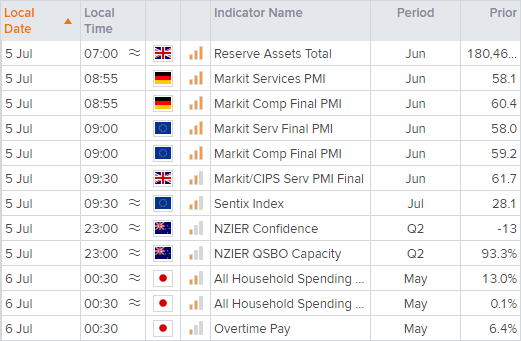
You can view all the scheduled events for today using our economic calendar, and keep up to date with the latest market news and analysis here.
How to trade with City Index
Follow these easy steps to start trading with City Index today:
- Open a City Index account, or log-in if you’re already a customer.
- Search for the market you want to trade in our award-winning platform.
- Choose your position and size, and your stop and limit levels.
- Place the trade.
Latest market news
Yesterday 01:23 PM
Yesterday 06:01 AM
April 18, 2024 11:27 PM
April 18, 2024 04:46 PM
Latest FTSE 100 articles
March 11, 2024 04:30 PM
March 5, 2024 12:00 PM
February 12, 2024 10:30 AM
January 15, 2024 12:30 PM