


Asian Indices:
- Australia's ASX 200 index rose by 1.5 points (0.02%) and currently trades at 7,060.10
- Japan's Nikkei 225 index has risen by 23.43 points (0.08%) and currently trades at 29,645.42
- Hong Kong's Hang Seng index has risen by 15.09 points (0.05%) and currently trades at 28,808.23
UK and Europe:
- UK's FTSE 100 futures are currently down -1.5 points (-0.02%), the cash market is currently estimated to open at 6,982.00
- Euro STOXX 50 futures are currently up 2 points (0.05%), the cash market is currently estimated to open at 3,995.43
- Germany's DAX futures are currently up 23 points (0.15%), the cash market is currently estimated to open at 15,278.33
Thursday US Close:
- The Dow Jones Industrial rose 305.1 points (0.9%) to close at 34,035.99
- The S&P 500 index rose 45.76 points (1.11%) to close at 4,170.42
- The Nasdaq 100 index rose 222.28 points (1.61%) to close at 14,026.20
China’s retail sales also accelerated by 34.2% YoY, up from 33.8% prior although industrial output fell to a ‘mere’ 14.1% YoY, down from 35.1% and urban investment was down to 25.6% from 35.0% previously.
Equity markets across Asia were mostly higher, led by the Shanghai Composite (SSEC). Although the ASX 200 failed to extend yesterday’s 14month high and is on track for close the day with a bearish pinbar, inside candle (indecision day with a slightly bearish undertone).
US futures are trading slightly lower, although perhaps there’s not much to read into here as the S&P 500, Nasdaq 100 and Dow Jones close to record highs. Euro STOXX 50 ad DAX futures are a touch higher, FTSE futures are effectively flat ahead of the open.
Learn how to trade indices
FTSE 100: Market Internals
The FTSE 100 rose to a 14-month high overnight and, just like the ASX 200 last week, has hit its head on 7,000. This is clearly the next milestone for UK equity traders to conquer, which would open up a run for 7,100 if they do. If prices retrace the bias remains bullish on the daily chart above 6850.
FTSE 100: 6983.5 (0.63%) 15 April 2021
- 72 (62.07%) stocks advanced and 28 (24.14%) declined
- 84.48% of stocks closed above their 200-day average
- 89.66% of stocks closed above their 50-day average
- 75.86% of stocks closed above their 20-day average
- 3 hit a new 52-week high, 0 hit a new 52-week low
Outperformers
- + 4.72% - Smurfit Kappa Group PLC (SKG.L)
- + 4.56% - GlaxoSmithKline PLC (GSK.L)
- + 3.74% - Mondi PLC (MNDI.L)
Underperformers:
- -5.02% - Legal & General Group PLC (LGEN.L)
- -2.33% - Lloyds Banking Group PLC (LLOY.L)
- -2.23% - Standard Life Aberdeen PLC (SLA.L)
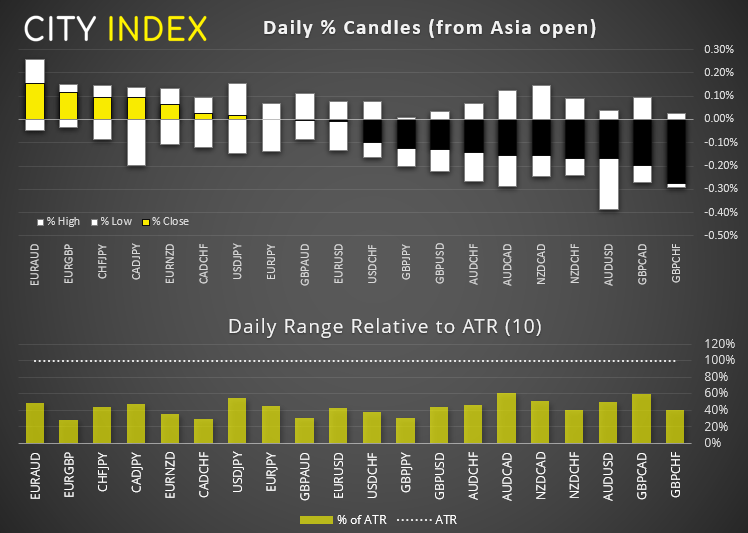
Forex: NZD is the strongest major this week
Volatility remained capped overnight, although the US dollar index (DXY) budged its was to a two-day high after printing a small indecision candle yesterday. As outlined in the Asian open report, we see the potential for a bounce form current lows but the bias remains bearish below 92.0.
- AUD and GBP are the weakest majors overnight, although AUD is the second strongest major this week (NZD is the strongest of the week and month-to-date).
- GBP/USD: Cable failed to close above 1.3783 resistance over two days and the 20-day eMA is now capping as resistance. Given it is trading lower overnight and DXY printed an indecision candle suggests the bias for today could be lower beneath yesterday’s highs.
- CHF/JPY is one to watch again after rolling over back below 118.0. Historically this area has seen some large declines, so the bias remains bearish below this week’s high.
Learn how to trade forex
Commodities: The breakout with a silver lining
Whilst metals were broadly higher yesterday, in a way, it is silver which is outshining gold because it closed the day above resistance. Furthermore, there is little in the way of structural levels which might act as resistance going into this session.
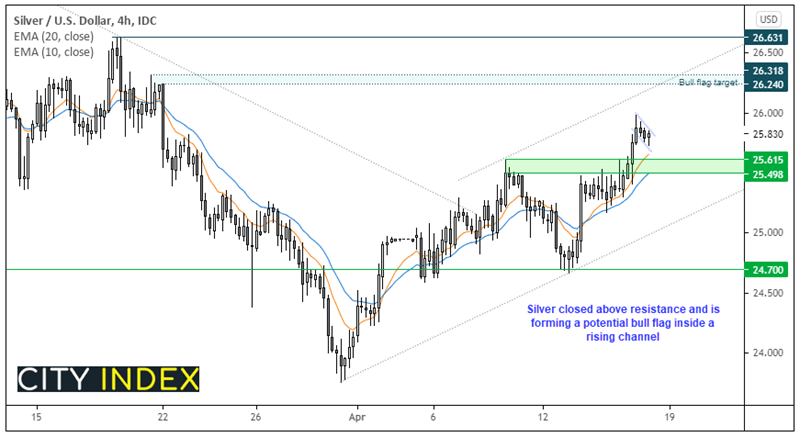
The four-hour chart is creating a strong trend within a bullish channel and the 10 and 20-bar eMA’s are providing dynamic support. That said, yesterday’s rise was so strong that prices are seemingly trying to accelerate further away from the averages as momentum picks up. A bull flag is also forming which project and approximate target around 26.30.
- Given the strength of momentum, the bias is for a direct break above yesterday’s high to confirm the bull-flag.
- If prices continue to retrace, bulls could consider bullish opportunities above the 25.50/62 support zone.
- The upper channel can also be used as a dynamic target if prices do rise over time.
Up Next (Times in BST)
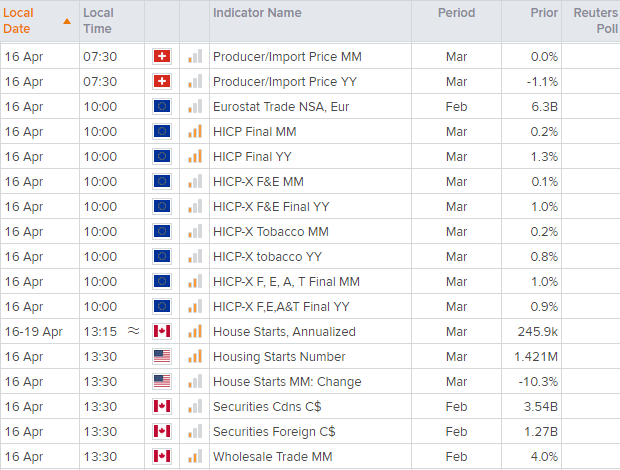
You can view all the scheduled events for today using our economic calendar, and keep up to date with the latest market news and analysis here.
Latest market news
Yesterday 01:23 PM
Yesterday 06:01 AM
April 18, 2024 11:27 PM
Latest FTSE 100 articles
March 11, 2024 04:30 PM
March 5, 2024 12:00 PM
February 12, 2024 10:30 AM
January 15, 2024 12:30 PM