


EUR/GBP falls as more BoE rate hikes are expected
- UK CPI cools less than forecast to 10.1%
- BoE peak rate seen at 5% in September
- EUR/GBP tests 100 sma
The pound has rallied after CPI data showed that inflation cooled by less than expected to 10.1% YoY in March down from 10.4%, but ahead of the 9.8% forecast and the 7th straight month in double digits.
Core inflation was also stronger than forecast holding steady at 6.2%, defying expectations of a fall to 6%. Services inflation, a figure that the BoE will be watching closely also ticked higher.
The data comes hot on the heels of UK jobs data which showed that wage growth was stronger than expected and serves as a reminder that this is going to be a long slow grind back to the BoE’s 2% target. The central bank clearly still has work to do to get inflation back under control.
Strong wage growth and stubbornly high inflation data has fueled bets that the Bank of England will hike interest rates again in May. Traders are now betting that rates will peak at 5% in September, up from the current 4.25% level.
Britain’s inflation is proving to be stickier than prices in the US or the eurozone, where CPI prices have been cooling for months.
Eurozone CPI data is due later today and is expected to confirm that CPI cooled to 6.9% YoY in March from 8.5%.
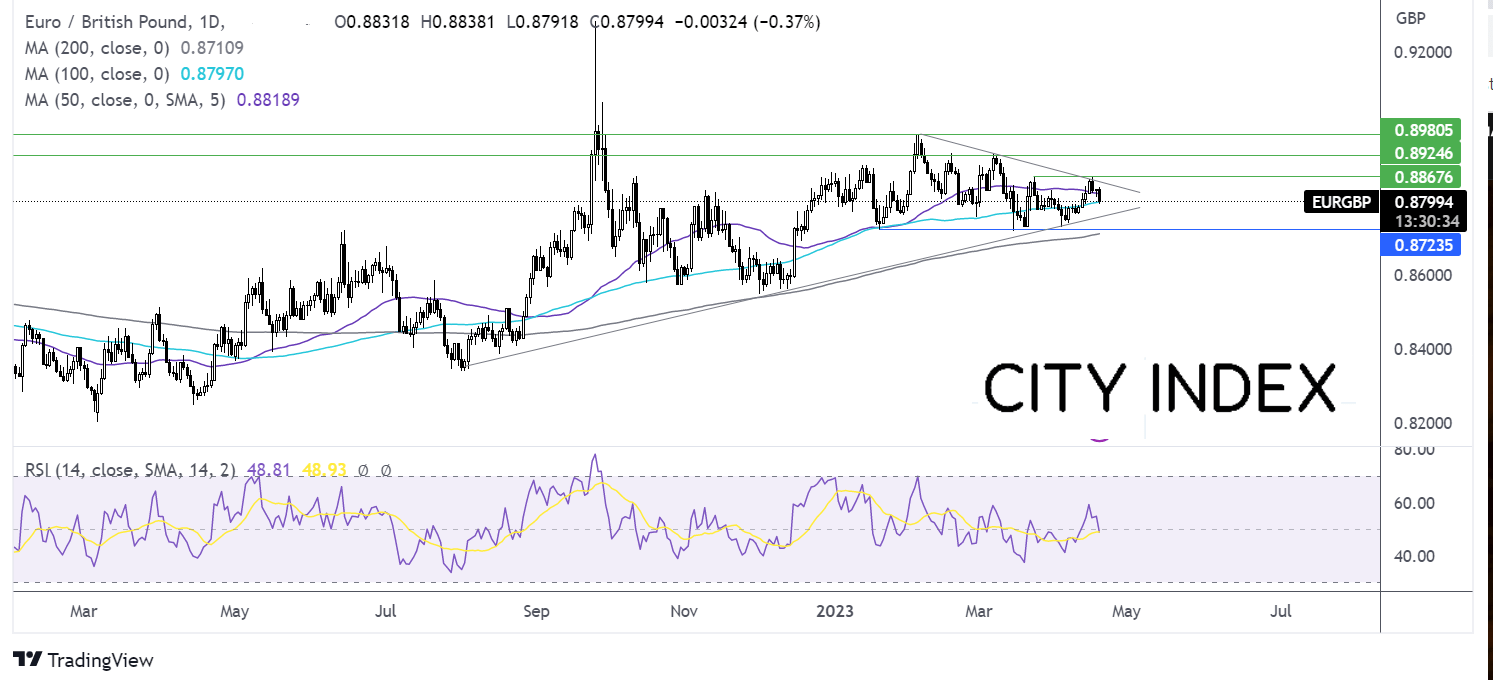
Where next for EUR/GBP?
EUR/GBP ran into resistance at 0.8865, a monthly high on Monday and has reversed lower, breaking below the 50 sma and is testing the 100 sma at 0.88.
Sellers need to break below this level to bring 0.8755 the rising trendline support into focus and 0.8720, the 2023 low.
On the flip side, should buyers successfully defend the 100 sma bulls could look for a rise above 0.8850 the falling trendline resistance, and 0.8865 to create a higher high.
Oil edges lower ahead of EIA stockpile data
- Oil falls as US rate hike & recession worries rise
- China’s GDP growth & falling inventories limit the downside
- Oil could test April lows
Oil prices are falling on Wednesday as investors weigh up the possibility of another interest rate hike from the Federal Reserve against falling US inventory data and encouraging data from China.
Atlanta Fed President Raphael Bostic said that the Federal Reserve will likely hike rates one more time in May to fight inflation. Higher interest rates will slow growth, hurting the oil demand outlook especially as we head toward the key US driving season.
These concerns are overshadowing encouraging signs of growth in China, where the latest GDP data highlighted a solid rebound in the economy from the pandemic. Moreover, API data which showed that US crude oil stockpiles fell by 2.68 million barrels in the week ending April 14. EIA stockpile data will be in focus later today.
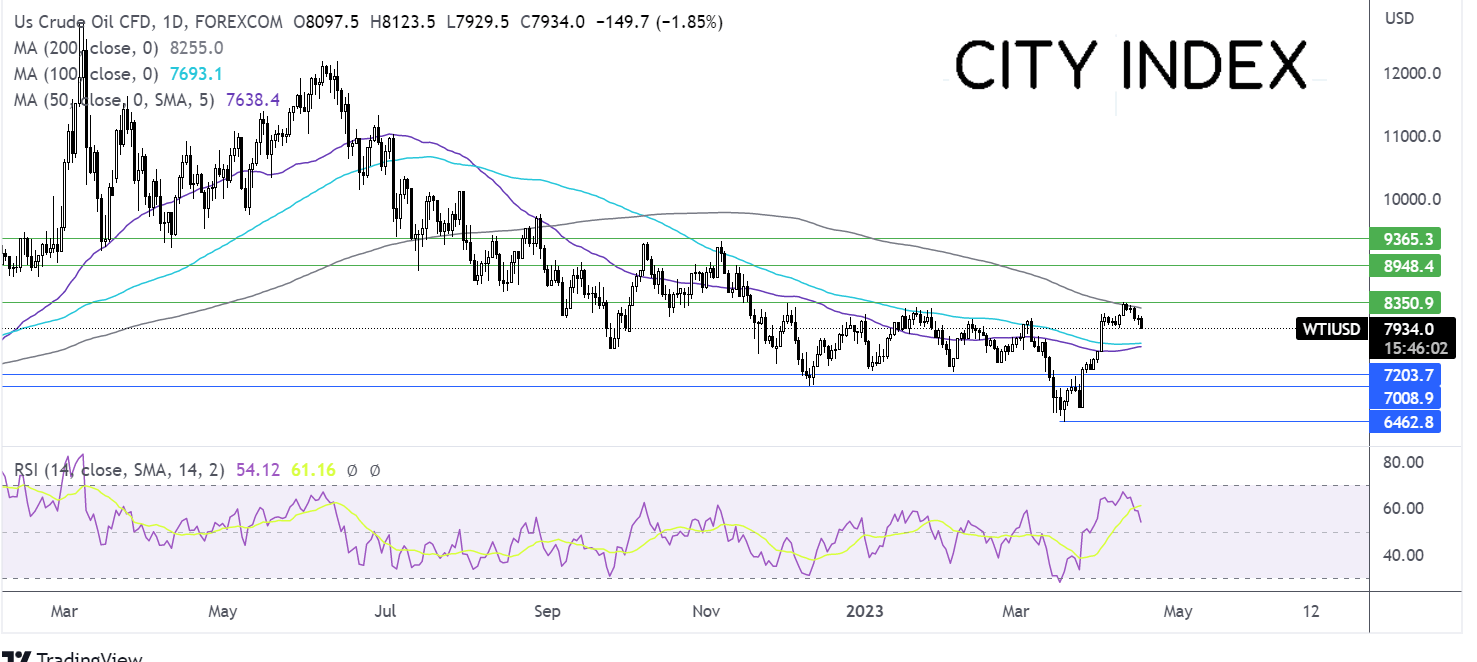
Where next for oil prices?
Oil continues to trade relatively range-bound, capped on the upside by 83.50 and on the lower side by 72.00.
After making an attempt on 83.50 late last week, the upper band of the horizontal trading pattern and the 200 sma, the oil price has eased lower towards 80.00. The RSI remains bullish above 50.
Buyers could look for a rise above the 200 sma at 82.55 and the upper band at 83.50 to open the door towards 90.00 round number.
Meanwhile, sellers will look for a break below 79.40 the April low to expose the 100 sma at 77.00. A break below here brings 72.00 the lower band of the horizontal pattern into target.
Latest market news
Today 11:14 AM
Today 08:28 AM
Yesterday 03:30 PM
Yesterday 01:23 PM
Latest Trade articles
March 25, 2024 09:17 AM
January 26, 2024 09:38 AM
January 25, 2024 09:33 AM
November 20, 2023 10:22 PM