


February 11, 2020 11:35 AM
EUR/CHF – It’s All about the RSI
Yes, it’s true the EUR/USD has had six straight down days entering today. However, just because the EUR/USD has been moving lower lately, it does not justify the move lower in EUR/CHF, which has been moving lower since late October! But is it time for the pair to bounce? When we look at the EUR/CHF across multiple timeframes, they all seem to have one thing in common, the RSI is diverging with price!
According to Investopedia, the Relative Strength Index (RSI) is a momentum indicator that measures the magnitude of recent price changes to evaluate overbought or oversold conditions in the prices of a stock or other asset. The RSI is displayed as an oscillator and can have a reading from 0 to 100. An RSI with a value above 70 is considered overbought and a reading of below 30 indicates oversold. A bullish divergence occurs when the RSI creates an oversold reading followed by a higher low that matches correspondingly lower lows in price. A bearish divergence occurs when the RSI creates an overbought reading, followed by a lower high that matches correspondingly higher highs in price.
On a weekly timeframe, EUR/CHF has been moving lower in earnest since mid-May 2018. Price is currently at 1.0670, very close to the 61.8% retracement level from the January 2015 lows (when the SNB pulled the 1.2000 EUR/CHF peg) to the May 2018 highs, which also represents horizontal support. Price has filled the gap from mid-April 2017. Notice how the RSI is diverging from price. Price is making a lower low and the RSI is making a higher low, which is a bullish divergence:
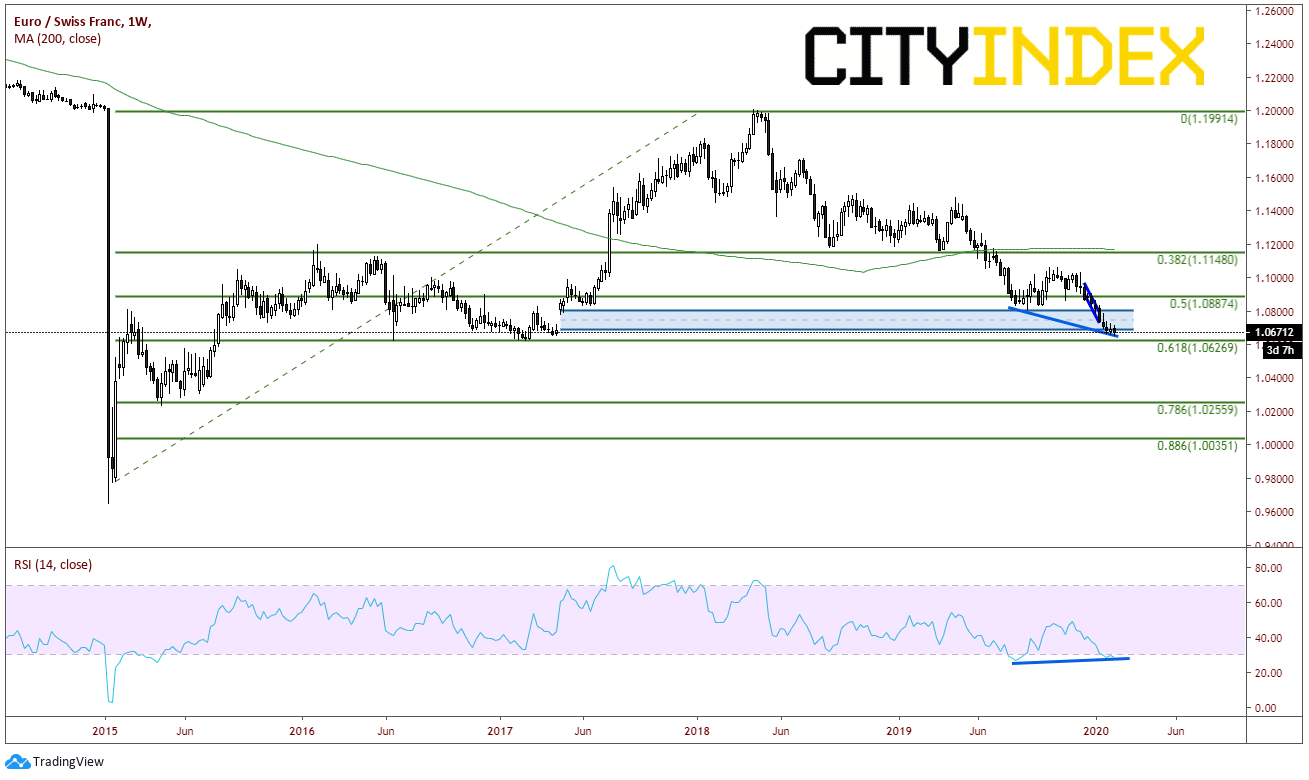
Source: Tradingview, City Index
On a daily timeframe, one only needs to go back to January 24th to see the divergence. Price is putting in lower lows as the RSI is putting in higher lows (a bullish divergence):
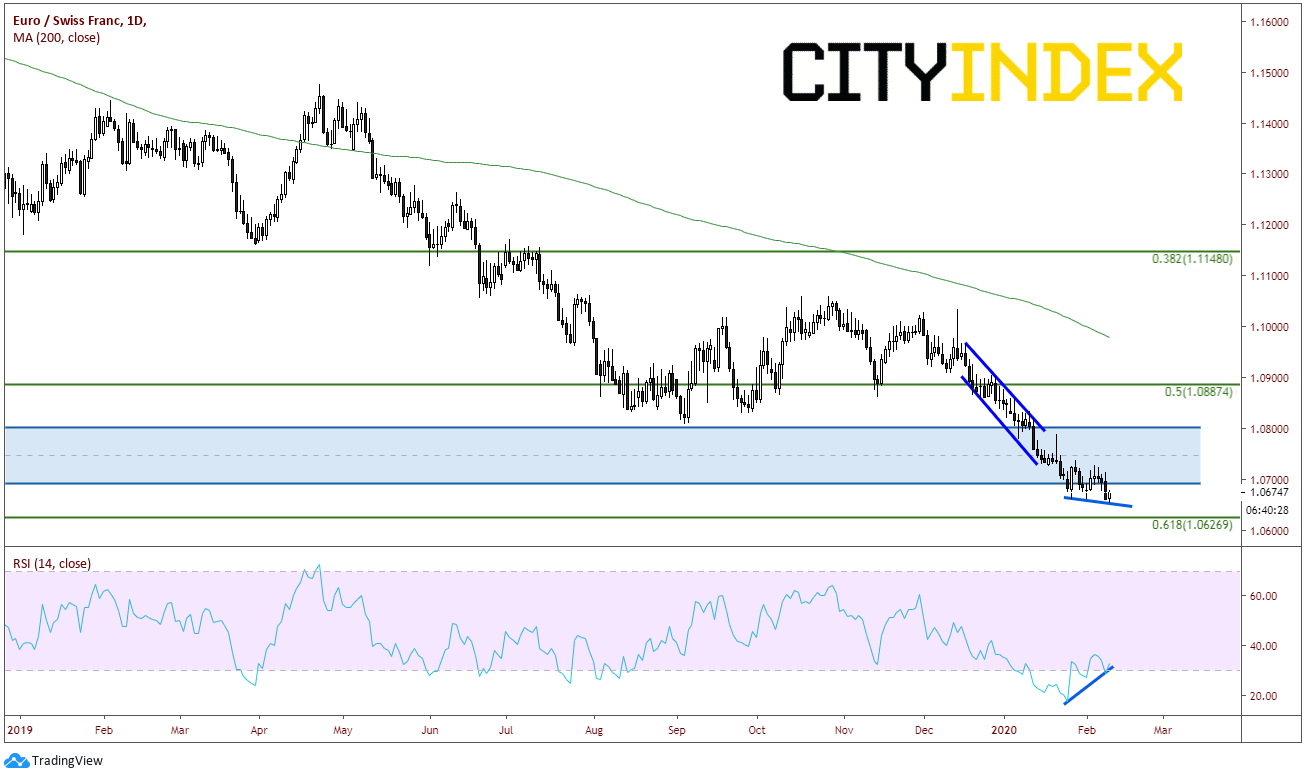
Source: Tradingview, City Index
Even on a 240-minute timeframe, one only needs to go back to January 28th to see that the RSI and price are diverging (bullish divergence):
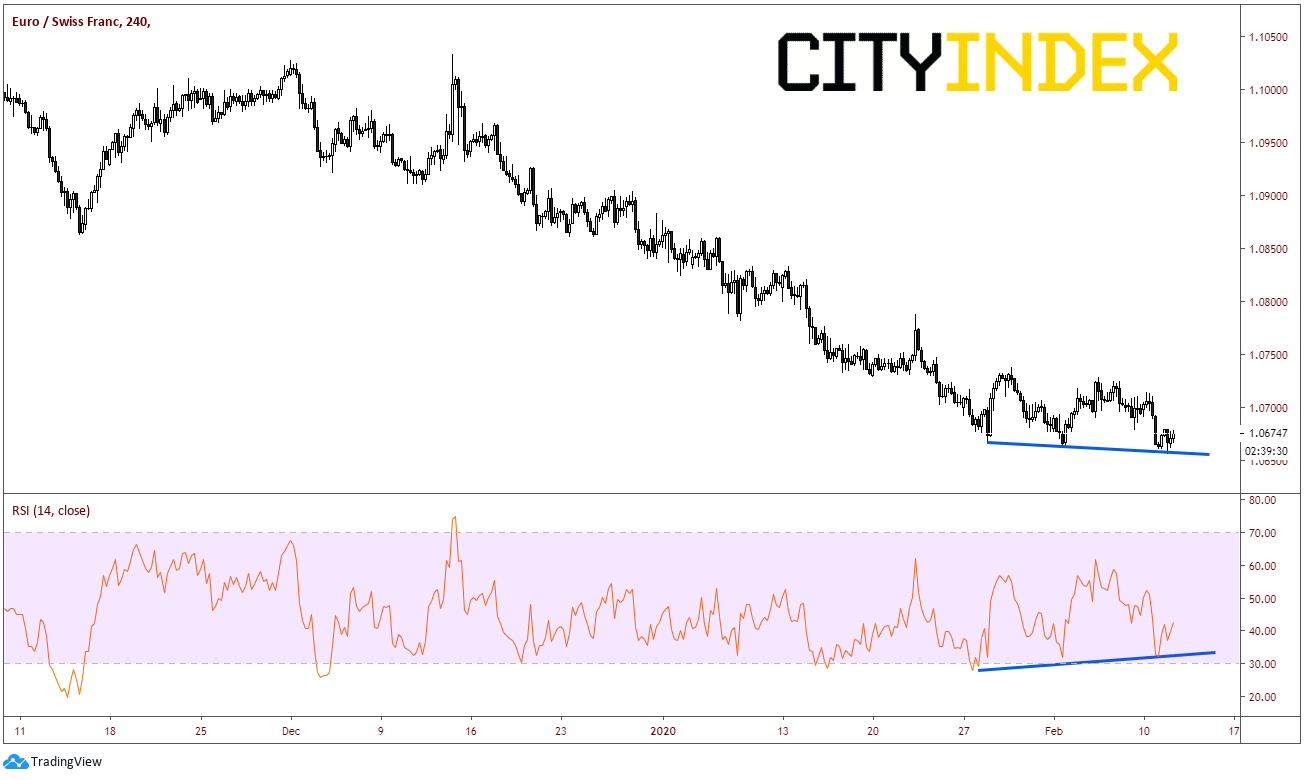
Source: Tradingview, City Index
What does it mean when price is diverging with the RSI? This is an indication that there may be price reversal ahead shortly. However, when divergences occur across multiple timeframes, it provides stronger support to the theory that a price reversal may be ahead. In addition, when you add in other technical indicators, such as the 61.8% Fibonacci retracement level, the horizontal support, and the gap fill on the weekly, it provides a stronger narrative due to a confluence of supports.
Will EUR/CHF reverse here? Nothing is certain. But the idea is to try and determine a confluence of many indicators (both technical and fundamental). This will increase the odds of the trade working out in your favor. When there are diverging RSIs with price, across multiple timeframes, odds increase of a reversal in price.
Latest market news
Today 08:28 AM
Yesterday 03:30 PM
Yesterday 01:23 PM
Yesterday 11:00 AM
Yesterday 08:15 AM
Latest Dollar articles
April 23, 2024 11:09 PM
April 18, 2024 06:20 AM
February 16, 2024 11:30 AM
February 7, 2024 03:30 PM