


July 15, 2019 2:32 AM
With Japanese markets closed for the Marine Day national holiday, the focus of today's session in Asia has been on the release of China’s Q2 GDP and June activity data.
As widely predicted by economists and in Chinese press reports last Friday, annual growth slowed to 6.2% in Q2 from 6.4% in Q1, thereby confirming China’s growth is at its weakest level since the early 1990s. One of the peculiarities surrounding the quarterly release of Chinese GDP data is that it has printed within 0.1ppt of the median Bloomberg forecast every quarter since June 2015. Although the number has made headlines today, it shouldn’t come as a shock.
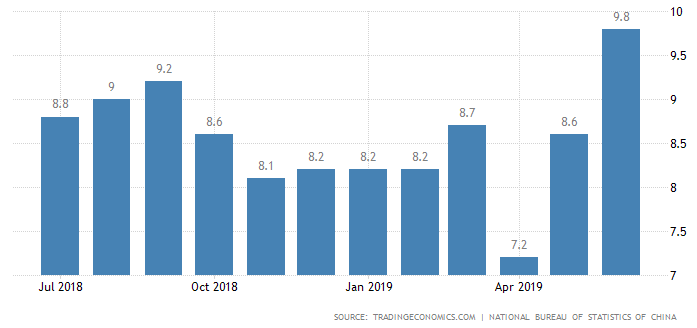
Providing a pleasant upside surprise, Chinese activity data for June including fixed asset investment, retail sales and industrial production all beat market expectations. Finally, some compelling evidence that the policy stimulus unleashed by Chinese authorities at the beginning of the year is gaining traction, which leaves the soft prints in April and May standing out as potential medium-term low points in the growth cycle. The chart below of Chinese retail sales year on year illustrates this point well.
In terms of market reactions, the AUD, which is part of the China complex is trading higher against the U.S. dollar and on most of the main cross rates. One cross rate in particular has caught the eye.
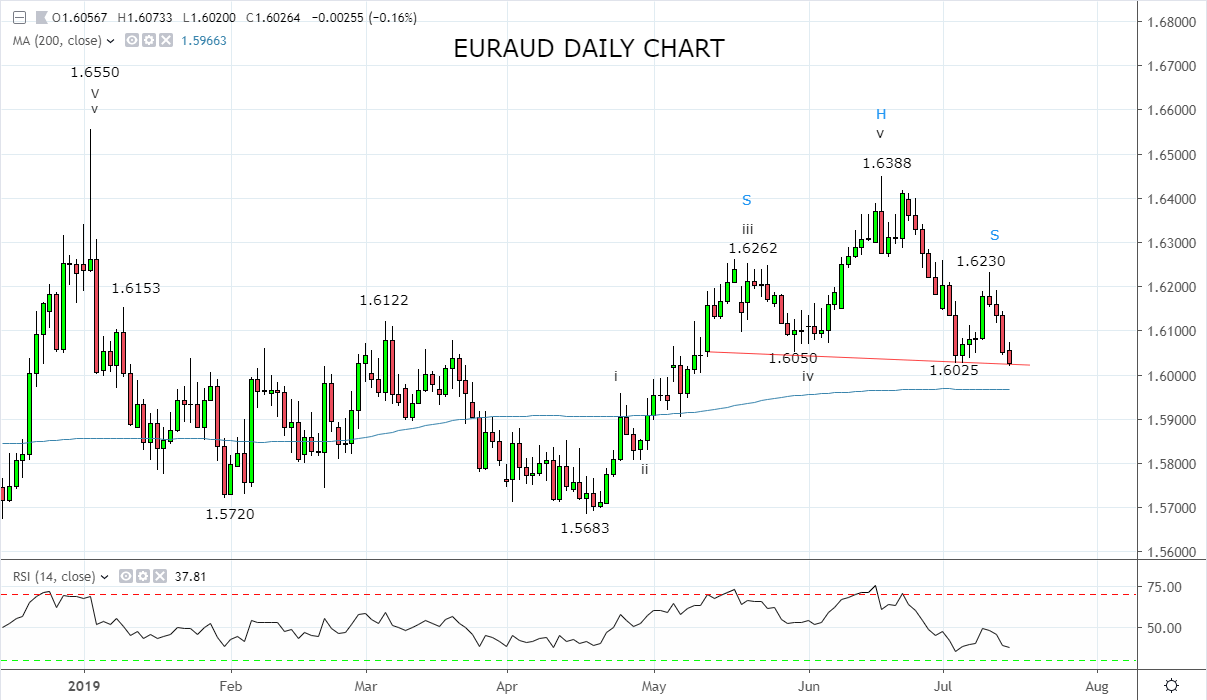
Technically, EURAUD is sitting right on the support provided by the neckline (1.6020) of a possible inverted head and shoulders top as viewed on the chart below. Should EURAUD break and close below the neckline 1.6020 area, and then below the support coming from the 200-day moving average 1.5970 area, it opens the way for EURAUD to revisit the 1.5683 low from mid-April.
As such, a short EURAUD trade is firmly on the radar in coming days ideally after the release tomorrow of the RBA meeting minutes and the Australian labour market report on Thursday.
Disclaimer
TECH-FX TRADING PTY LTD (ACN 617 797 645) is an Authorised Representative (001255203) of JB Alpha Ltd (ABN 76 131 376 415) which holds an Australian Financial Services Licence (AFSL no. 327075)
Trading foreign exchange, futures and CFDs on margin carries a high level of risk and may not be suitable for all investors. The high degree of leverage can work against you as well as for you. Before deciding to invest in foreign exchange, futures or CFDs you should carefully consider your investment objectives, level of experience, and risk appetite. The possibility exists that you could sustain a loss in excess of your deposited funds and therefore you should not invest money that you cannot afford to lose. You should be aware of all the risks associated with foreign exchange, futures and CFD trading, and seek advice from an independent financial advisor if you have any doubts. It is important to note that past performance is not a reliable indicator of future performance.
Any advice provided is general advice only. It is important to note that:
- The advice has been prepared without taking into account the client’s objectives, financial situation or needs.
- The client should therefore consider the appropriateness of the advice, in light of their own objectives, financial situation or needs, before following the advice.
- If the advice relates to the acquisition or possible acquisition of a particular financial product, the client should obtain a copy of, and consider, the PDS for that product before making any decision.
Latest market news
Today 11:14 AM
Today 08:28 AM
Yesterday 03:30 PM
Yesterday 01:23 PM
Latest Forex articles
Yesterday 11:00 AM
April 23, 2024 11:09 PM
April 23, 2024 04:00 PM