


iShares MSCI Emerging Markets (EEM) – Losing upside momentum at key resistance
click to enlarge charts
Key Levels (1 to 3 months)
Pivot (key resistance): 46.10
Supports: 43.35, 42.20 & 40.10
Next resistance: 50.18 (major)
Directional Bias (1 to 3 months)
The share price of EEM has rallied by close to 10% in the month of Dec 2019 to print a high of 45.78 on 02 Jan 2020 reinforced by the de-escalation of trade tension between U.S. and China via the impending agreement of the official Phase One trade deal sign-off on 15 Jan 2020. From its 14 Aug 2019 swing low of 38.72, the EEM has recorded a return of 18%
From a macro environment perspective, the rosy picture has started to turn “greyish” with rising geopolitical risk in the Middle East that has triggered a spike in oil prices. Almost half of major emerging market economies are net oil importers such as India, China, South Africa, thus a runaway rise in oil prices can have adverse effects on these countries’ sovereign balance sheets which in turn lower economic growth prospects.
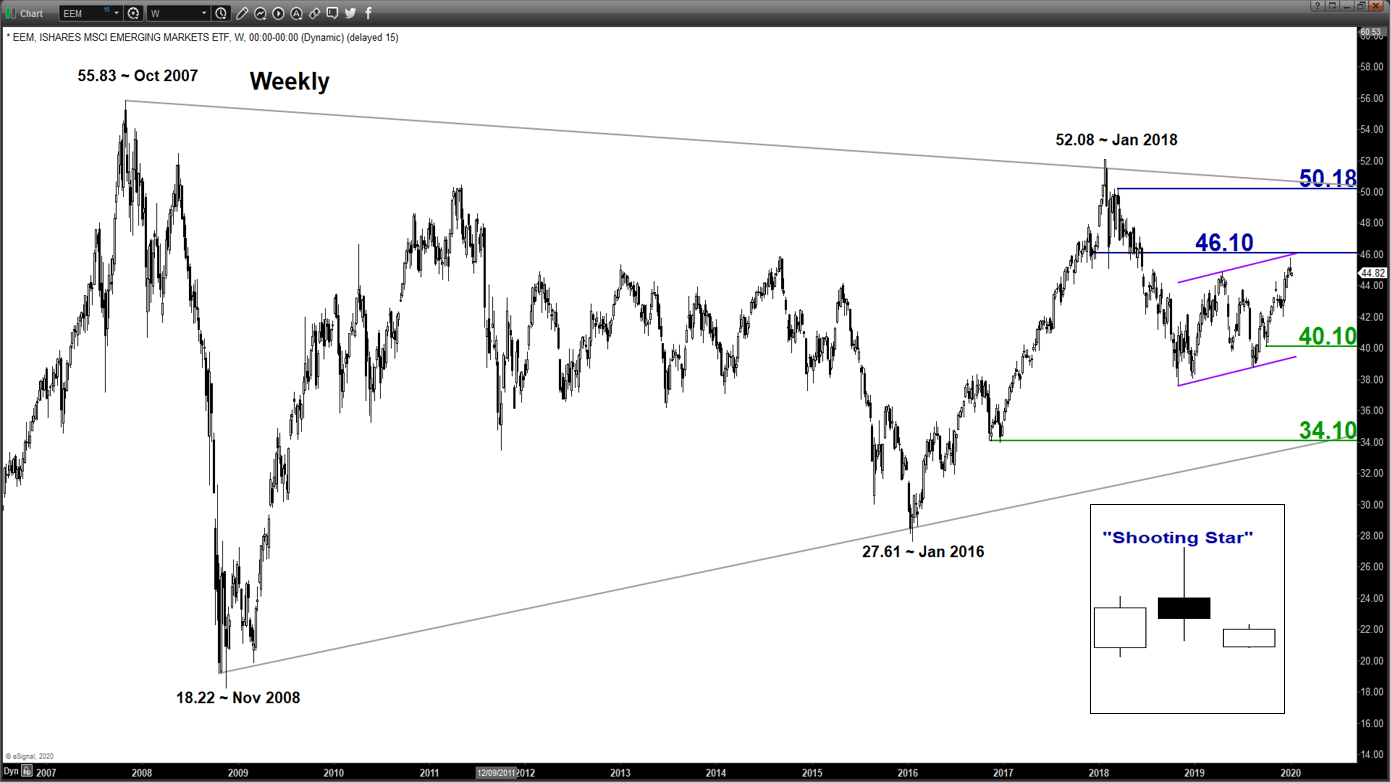
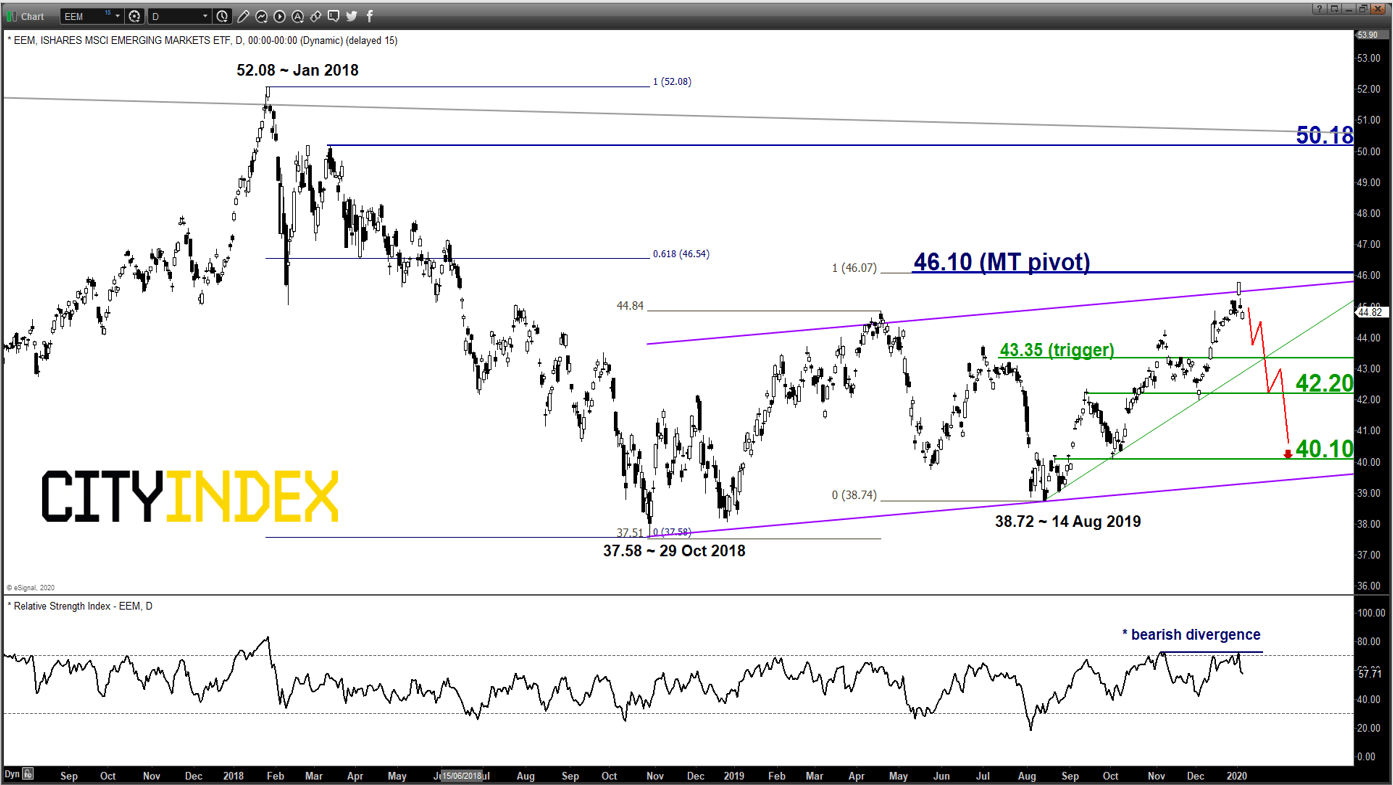
Bearish bias below 46.10 key medium-term pivotal resistance and a break below 43.35 is likely to reinforce a further potential slide to target the next supports at 42.20 and 40.10 next within a long-term secular “Symmetrical Triangle” range configuration in place since Oct 2007.
On the other hand, a clearance with a daily close above 46.10 invalidates the bearish scenario for a rally towards the major resistance at 50.18 (Fibonacci expansion cluster & upper boundary of the “Symmetrical Triangle”).
Key elements
- The recent rally of the EEM has reached an inflection level of 46.10 which is defined by a medium-term ascending range configuration in place since 29 Oct 2018, the congestion area of 09 Feb/06 June 2018 and a Fibonacci retracement/expansion cluster.
- Price action has formed a weekly bearish “Shooting Star” candlestick pattern coupled with a bearish divergence signal seen in the daily RSI oscillator at its oversold region. These observations suggest that medium-term upside momentum has stated to wane and the risk of a bearish reversal in price action increases at this juncture.
- The 40.10 significant medium-term support is defined by the 76.4% Fibonacci retracement of the recent up move from 14 Aug 2019 low to 02 Jan 2020 high and the lower boundary of the ascending range configuration.
Charts are from eSignal
Latest market news
Yesterday 08:33 AM
Latest Indices articles

April 17, 2024 11:00 AM
April 16, 2024 08:00 PM
April 16, 2024 04:54 PM