


July 29, 2022 4:43 PM
During the FOMC press conference earlier in the week, Fed Chairman Powell mentioned 2 data points that are important to the Fed. Powell noted at that the Personal Consumption Expenditure (PCE) was the Fed’s preferred measure of inflation as it captures more inflation data than CPI. The other measure he specifically mentioned and said that will be important for the Fed is the Employment Cost Index (ECI). Both of those data points were released earlier today. The ECI for Q2 rose by 1.3% vs an expectation 1.2% and a previous reading of 1.4%. The PCE Price Index for June rose 6.8% YoY vs 6.7% YoY expected and 6.3% YoY in May. This was the highest reading since January 1982! In addition, the Core PCE (which historically is the Fed’s favorite measure of inflation) rose 4.8% YoY vs an expectation of 4.7% YoY and 4.7% YoY in May. We’d be remiss if we didn’t mention that Personal Spending for June was 1.1% MoM vs 0.9% MoM expected and 0.3% MoM in May. Although the Fed won’t be happy with the higher inflation readings, it will like the fact that Personal Spending remains elevated as consumers deal with higher interest rates.
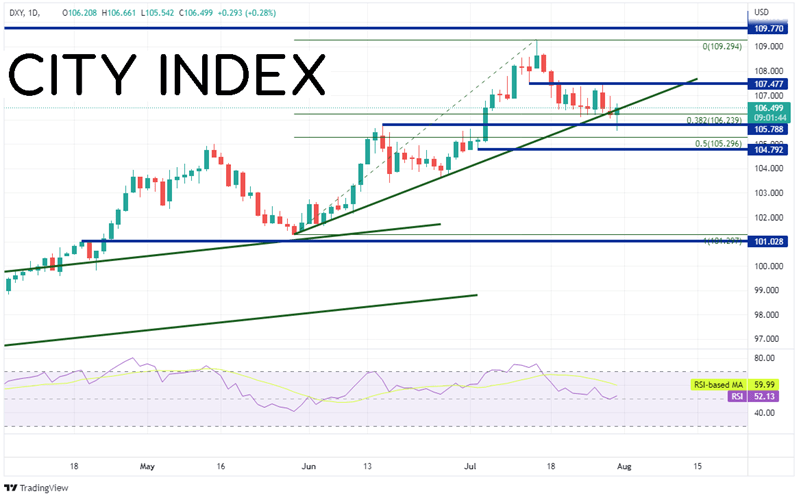
Although there is still over 50 days until the next FOMC meeting, today’s data caused traders to buy the US Dollar. Could the US Dollar Index be holding horizontal support and the 38.2% Fibonacci retracement level from the lows of May 30th to the highs of July 14th? A close above 106.24 would signal a reversal candle. First resistance is the highs from July 27th at 107.43. Above there, price can move to the 20-year highs at 109.29. However, if the DXY moves closes below 107.79, the next support level is near 105.30, which is the 50% retracement from the previously mentioned timeframe, then horizontal support at 107.79.
Source: Tradingview, Stone X
Trade the DXY now: Login or Open a new account!
• Open an account in the UK
• Open an account in Australia
• Open an account in Singapore
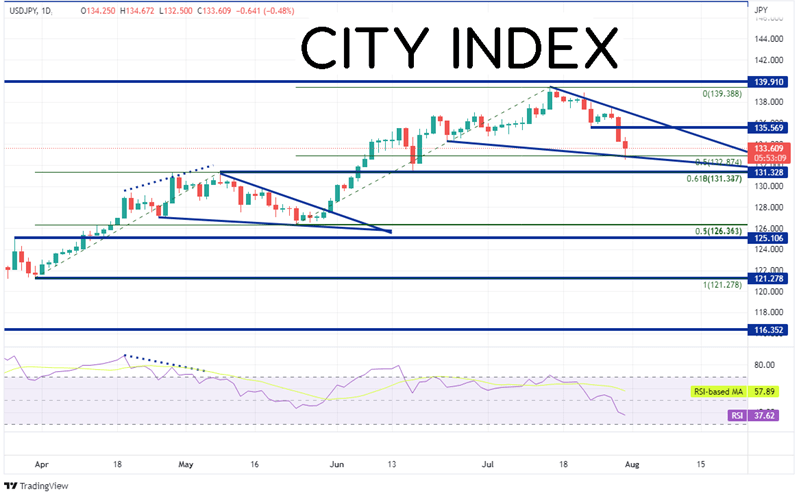
Yesterday we discussed USD/JPY and pondered whether or not the pair was entering a descending wedge, similar to the one from earlier in May. In May, the pair pulled back to the 50% retracement level from the lows of March 31st to the highs of May 9th, near 126.36, before breaking out of the wedge and moving aggressively higher. This time around, price reached a high of 130.39 on July 14th, and thus far, has pulled back to the 50% retracement level from the lows of May 24th to the highs of July 14th, near 132.87 (the actual low so far today so far is 132.50). Although it is still early in the day, the buying of US Dollars has brought the pair back up to near 134.00. If price closes near this level today, USD/JPY will have formed a hammer candlestick pattern, which is a 1-candle reversal pattern. If price move higher, first resistance is at the lows of July 22nd, near 135.26. Above there is the top, downward sloping trendline from the wedge near 137.50 and then the highs from July 14th, near 139.39, However, if USD/JPY falls below today’s lows, the next level of support is the 61.8% Fibonacci retracement from the previously mentioned timeframe at 131.35.
Source: Tradingview, Stone X
Trade USD/JPY now: Login or Open a new account!
• Open an account in the UK
• Open an account in Australia
• Open an account in Singapore
Today’s inflation data was higher than expected and the Fed is walking a thin line between lowering inflation and pushing growth lower. The US Dollar seems to be reacting to every headline and data point that comes out, which is causing volatility in USD/JPY. Watch to see if the descending wedge holds for the pair.
Learn more about forex trading opportunities.
Latest market news
Today 04:00 PM
Today 01:15 PM
Today 11:30 AM
Today 08:18 AM
Latest Trade Ideas articles
Today 04:00 PM
Today 11:30 AM
Today 08:18 AM