


September 2, 2019 1:05 AM
Spring is here, and a new season upon us. However, there is no end in sight to the grey clouds circling the global economy as the previously announced 15% tariffs on U.S. $110bn of Chinese consumer goods, including footwear, smart watches and flat-panel televisions took effect over the weekend as did retaliatory Chinese tariffs on U.S. $75 bn worth of imports from the U.S.
For those expecting the more conciliatory tone evident between the U.S. and China at the end of last week to manifest into a postponement to the latest round of tariffs, some disappointment is evident in markets today. S&P500 futures are currently trading -0.50% below Fridays close.
I would be very sceptical if a repeat of last Monday’s sharp reversal higher occurs. The reason being despite the U.S. manufacturing sector suffering under the trade tension headwinds, the U.S. economy has continued to grow, aided by the resilience of the U.S. consumer. At the end of last week some evidence that the U.S. consumer might finally be faltering.
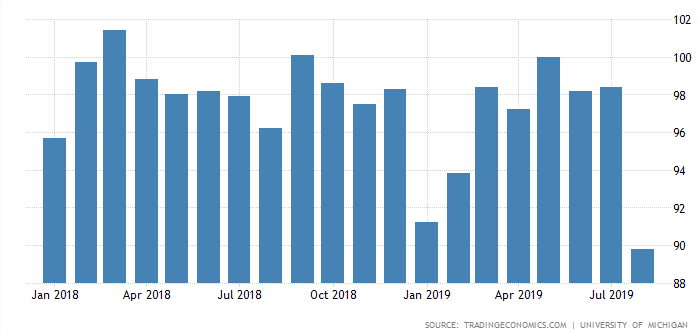
The University of Michigan’s final consumer sentiment survey showed consumer sentiment fell to 89.8 in August, its lowest level since October 2016 (chart below). Tariffs were flagged as a concern by one-in-three consumers, a reason for increased uncertainty and a reason to reduce consumer spending. If the U.S. consumer has finally blinked it is a negative development for U.S. equities.
Technically our view of the S&P500 is unchanged. A bearish view of the S&P500 remains in place, providing the S&P500 remains below the 78.6% Fibonacci retracement level at 2976 +/5 points. Confirmation that the next leg lower has commenced is a break/close below the August 2775.75 low. Should this occur the next downside target would then become the 2730/2700 support region.
Conversely, a daily close above 2976 +/5 points would necessitate a shift to a more neutral stance, at least from a technical point of view.
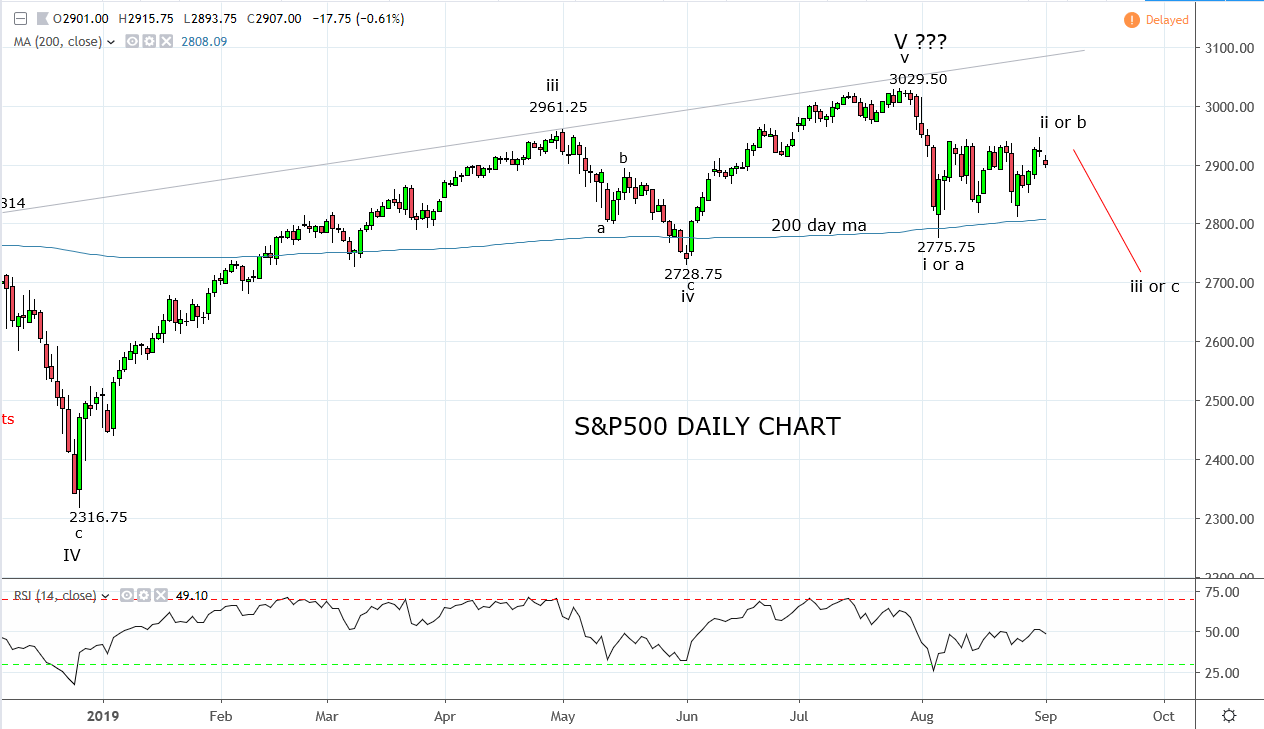
Source Tradingview. The figures stated are as of the 2nd of September 2019. Past performance is not a reliable indicator of future performance. This report does not contain and is not to be taken as containing any financial product advice or financial product recommendation
Disclaimer
TECH-FX TRADING PTY LTD (ACN 617 797 645) is an Authorised Representative (001255203) of JB Alpha Ltd (ABN 76 131 376 415) which holds an Australian Financial Services Licence (AFSL no. 327075)
Trading foreign exchange, futures and CFDs on margin carries a high level of risk and may not be suitable for all investors. The high degree of leverage can work against you as well as for you. Before deciding to invest in foreign exchange, futures or CFDs you should carefully consider your investment objectives, level of experience, and risk appetite. The possibility exists that you could sustain a loss in excess of your deposited funds and therefore you should not invest money that you cannot afford to lose. You should be aware of all the risks associated with foreign exchange, futures and CFD trading, and seek advice from an independent financial advisor if you have any doubts. It is important to note that past performance is not a reliable indicator of future performance.
Any advice provided is general advice only. It is important to note that:
- The advice has been prepared without taking into account the client’s objectives, financial situation or needs.
- The client should therefore consider the appropriateness of the advice, in light of their own objectives, financial situation or needs, before following the advice.
- If the advice relates to the acquisition or possible acquisition of a particular financial product, the client should obtain a copy of, and consider, the PDS for that product before making any decision.
Latest market news
Today 01:15 PM
Today 11:30 AM
Today 08:18 AM