EUR/USD – Hovering below 1.1200 minor key resistance
click to enlarge chart
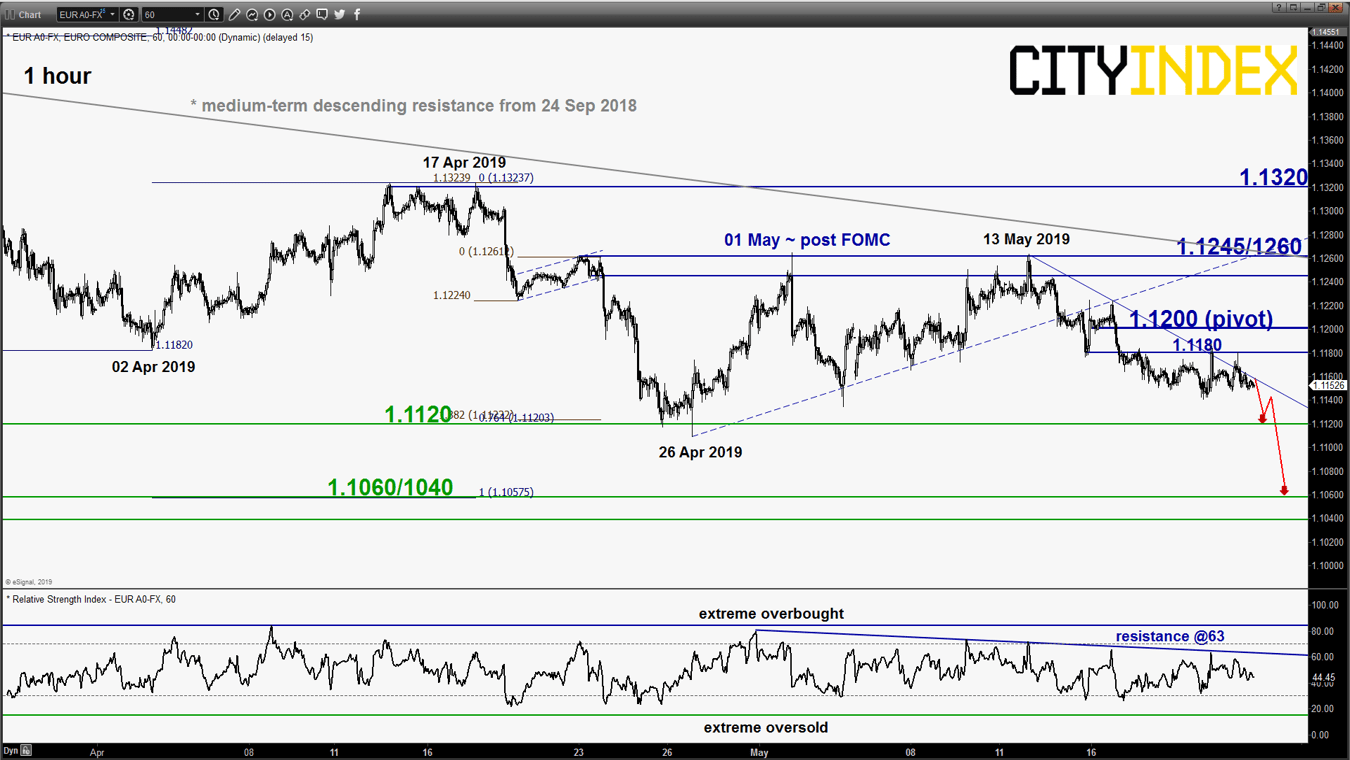
- Traded sideways below the 1.1200 key short-term pivotal resistance (click here for a recap on our previous report). Maintain bearish bias for further push down to retest 1.1120 and a break below it opens up scope for a further potential decline to target the next near-term support at 1.1060/1040 (Fibonacci retracement/expansion cluster).
- On the other hand, a break with an hourly close above 1.1200 negates the bearish tone for a corrective bounce towards 1.1245/1260 (range resistance in place since the recent FOMC meeting held on 01 May).
GBP/USD -Further potential slide to test major support
click to enlarge charts
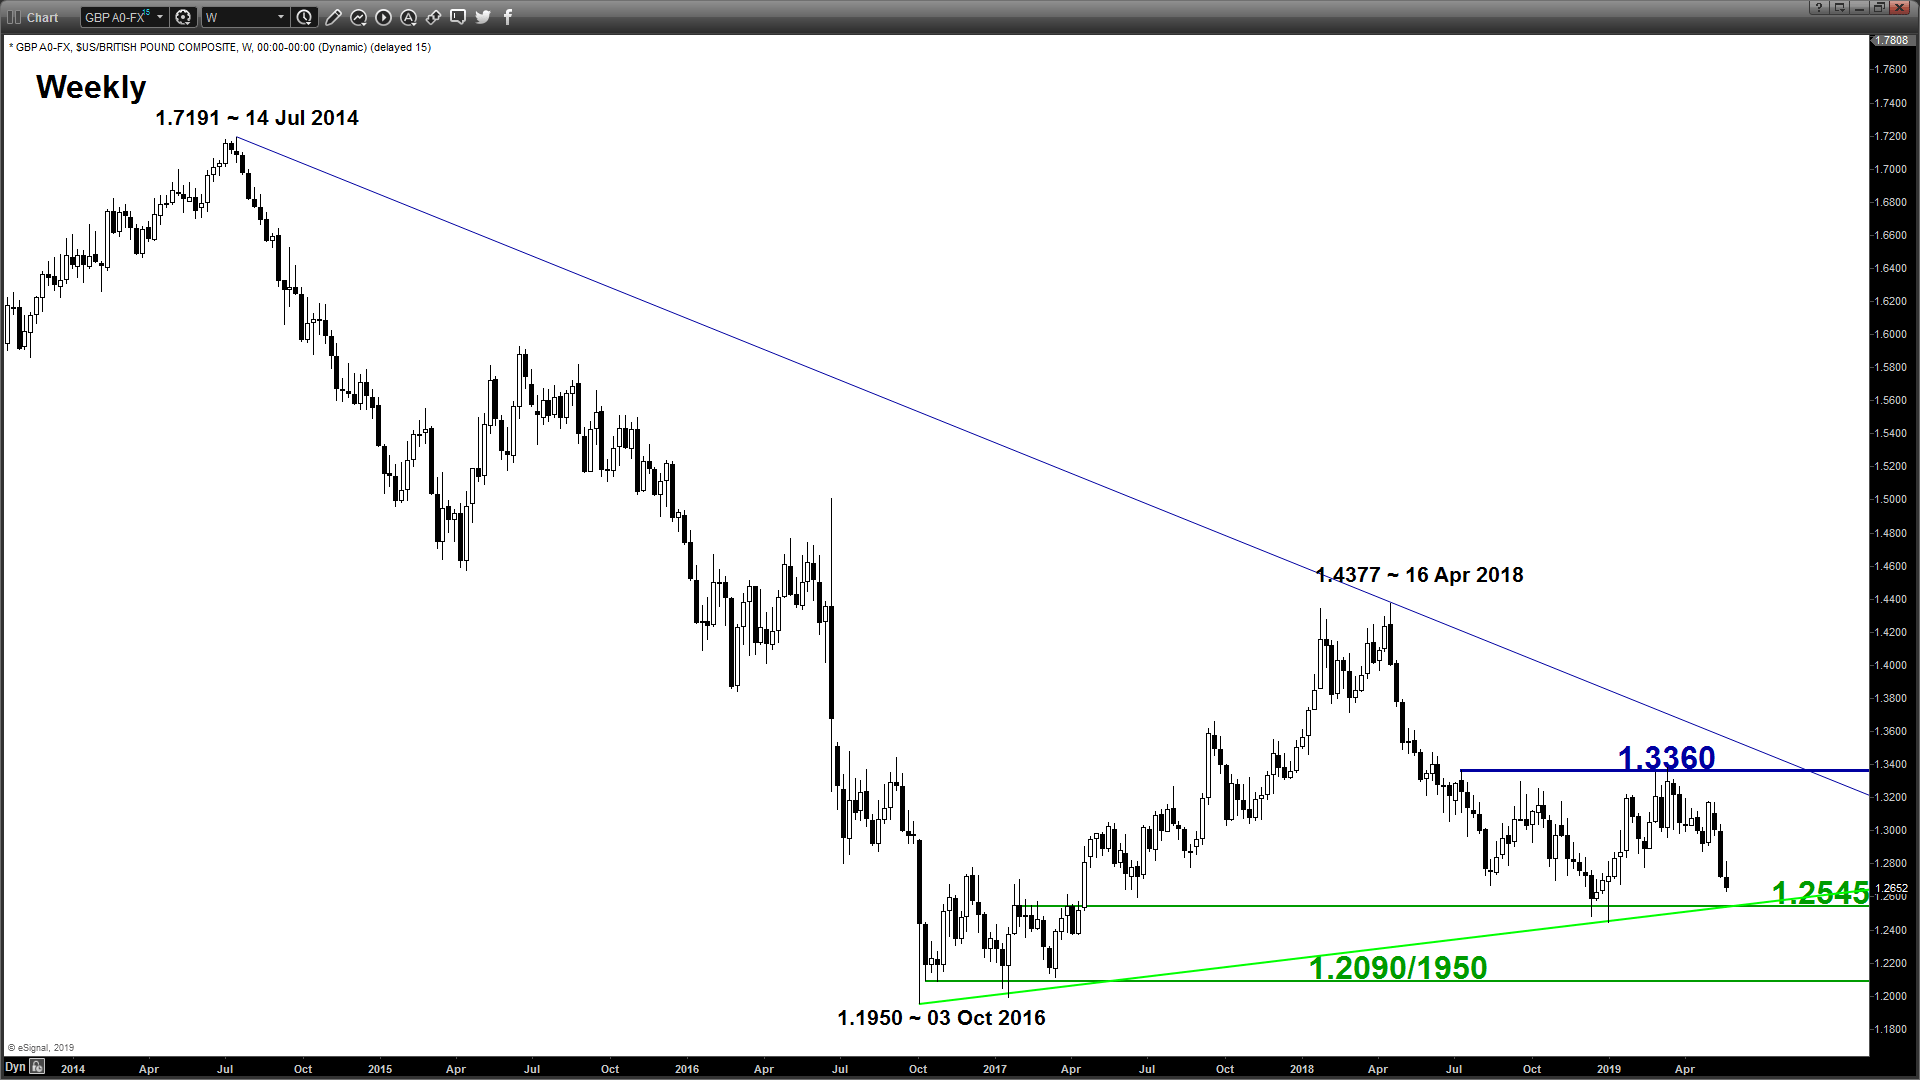
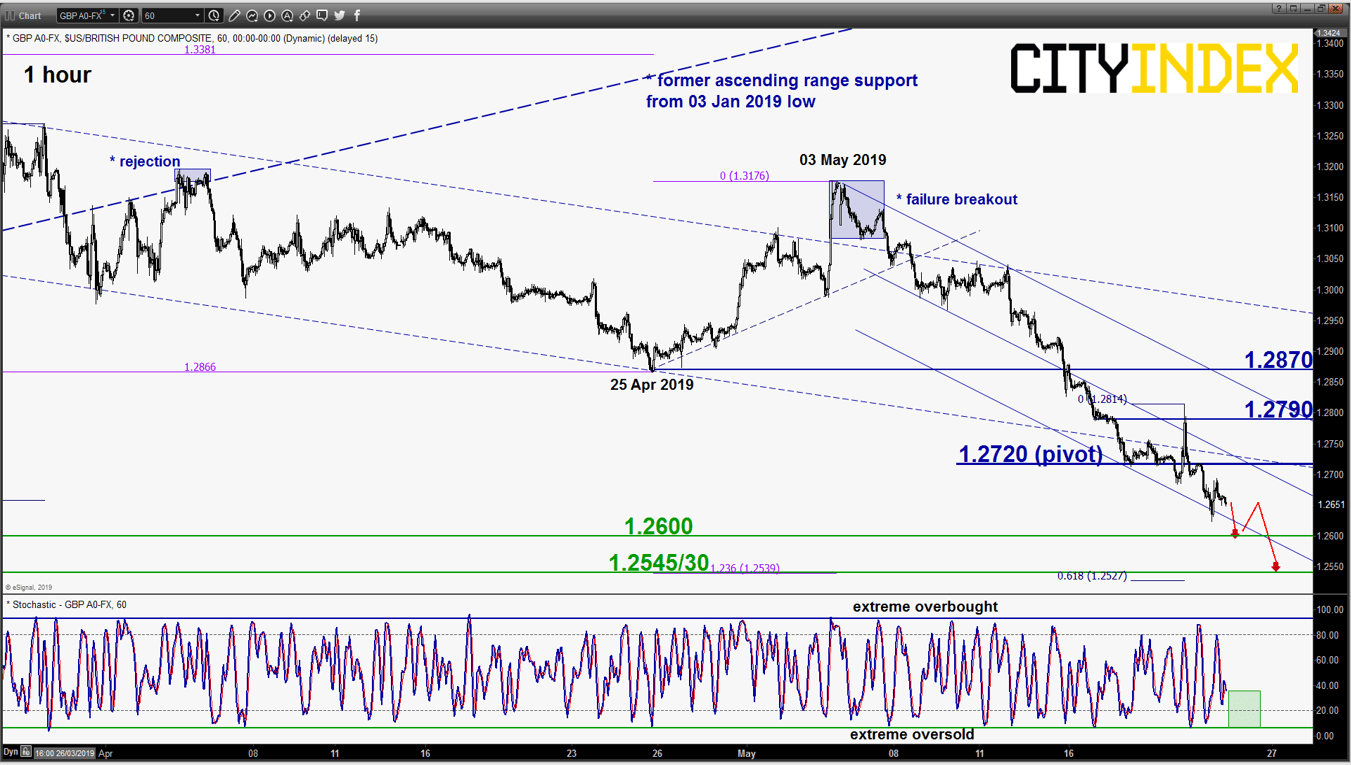
- Drifted down lower as expected and met the target/support at 1.2660 as per highlighted in our previous report (printed a low of 1.2623 in yesterday’s U.S. session). No clear signs of bearish exhaustion yet, maintain bearish bias with a tightened key short-term pivotal resistance now at 1.2720 for a further potential slide to target 1.2600 follow by 1.2545/30 (the major/primary ascending range support in place since 07 Oct 2016 low & Fibonacci projection cluster).
- On the other hand, a break with an hourly close above 1.2720 negates the bearish tone for a squeeze up to retest this week swing high at 1.2790.
USD/JPY – Pull-backed towards minor key support
click to enlarge chart
- Drifted down by 57 pips from its Tues, 21 May U.S. session swing high of 110.65 to test the 110.20 key short-term pivotal support in today’s Asian session. Maintain bullish bias and added 110.35 (minor descending trendline from 21 May 2019 high) as the upside trigger level to reinforce another potential upleg of the on-going corrective rebound sequence in place since 13 May 2019 low to retest 110.65 before targeting 110.95/111.10 (the gapped down formed on 06 May 2019 & a Fibonacci retracement/expansion cluster).
- On the other hand, failure to hold 110.20 with an hourly close below it revives the bearish tone for a slide to retest the 13 May 2019 swing low of 109.00 in the first step.
AUD/USD – No clear signs of bearish exhaustion
click to enlarge chart
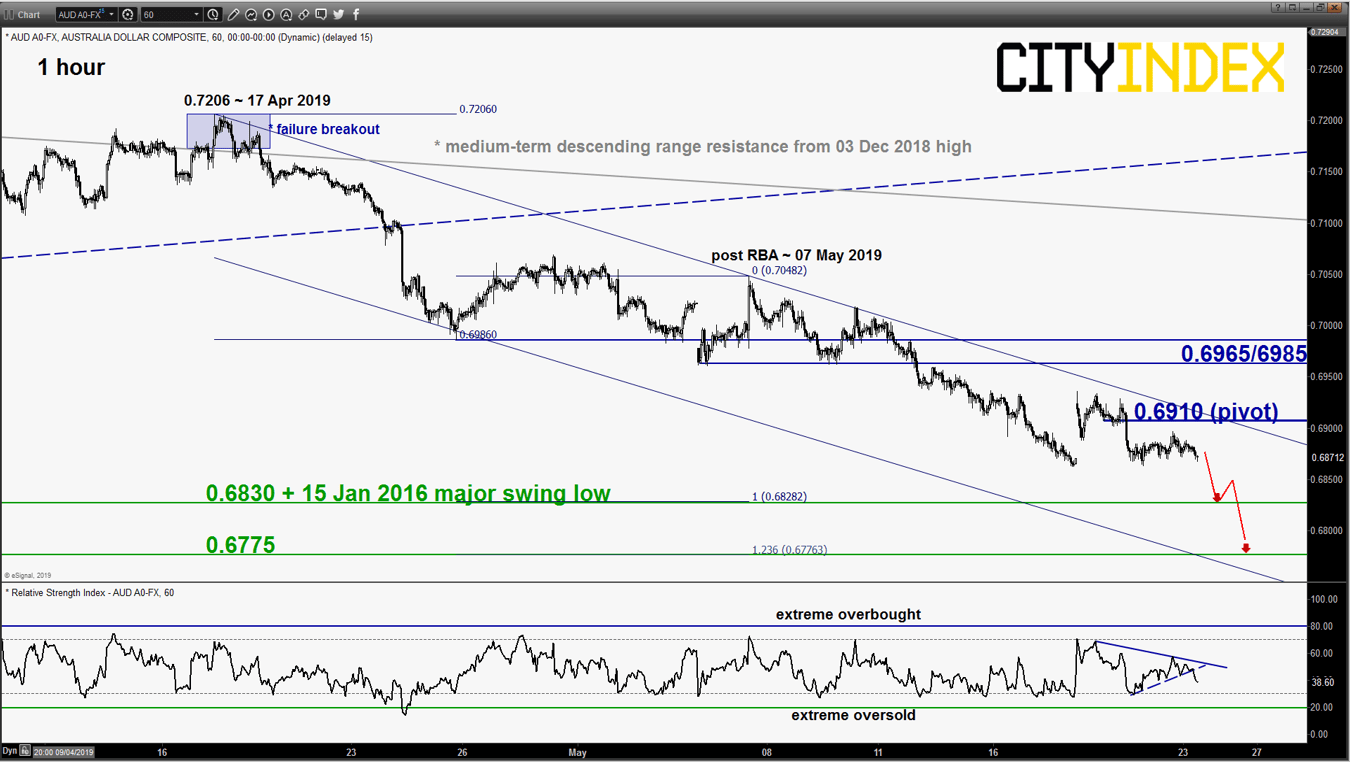
- Traded sideways above last Fri, 18 May low of 0.6865 but short-term momentum remains negative that supports further downside pressure in price action. The hourly RSI oscillator has broken below a corresponding ascending support at the 45 level and still has further room to manoeuvre to the downside before it reaches an extreme oversold level. Maintain bearish bias with a tightened key short-term pivotal resistance now at 0.6910 for a further potential push down to test the significant support at 0.6830. A daily close below it opens up scope for a further decline to target the next near-term support at 0.6775 (1.236 Fibonacci expansion of the decline from 17 Apr 2019 high & lower boundary of the descending channel from 17 Apr 2019 high).
- On the other hand, a break with an hourly close above 0.6910 negates the bearish tone for a squeeze up towards the next intermediate resistance zone at 0.6965/6985.
Charts are from eSignal


