


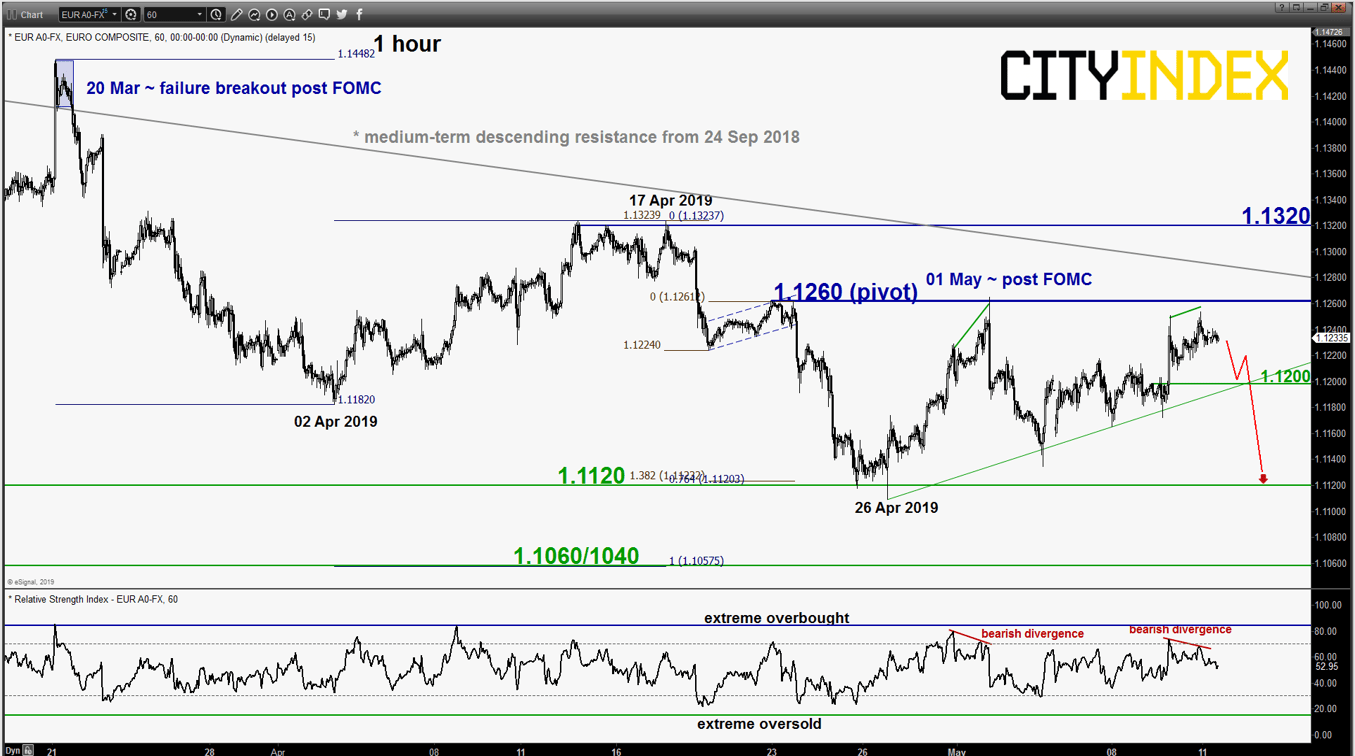
EUR/USD – 1.1260 remains the key resistance to watch
click to enlarge chart
- Inched higher but remained below the 1.1260 key short-term pivotal resistance as per highlighted in our previous report (click here for a recap). Short-term momentum has started to turn negative as the hourly RSI oscillator has flashed a bearish divergence signal at its overbought region last Fri, 10 May. Interestingly, similar observation on the hourly RSI has been detected on 30 Apr/01 May; post FOMC which the price action shaped a slide of 130 pips thereafter.
- Maintain bearish bias with 1.1260 remains as the key short-term pivotal resistance and a break below 1.1200 (minor ascending support from 263 Apr 2019 low) reinforces a potential slide to retest 1.1120 in the first step. However, an hourly close above 1.1260 invalidates the bearish scenario for a further corrective push up towards the key 1.1320 medium-term resistance.
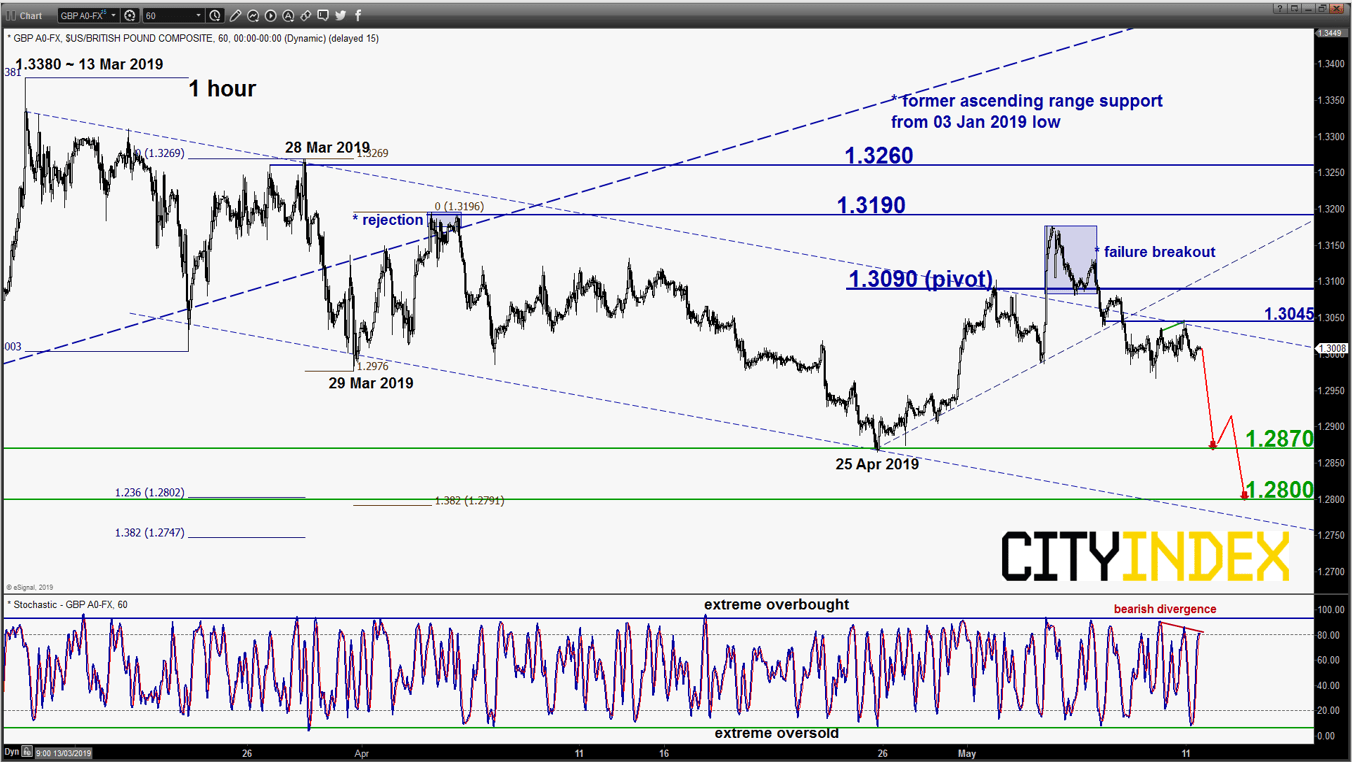
GBP/USD – Further potential decline within range in progress
click to enlarge chart
- Reacted off from the 1.3045 intermediate resistance on last Fri, 10 May after a challenge on it coupled with a bearish divergence signal seen in the hourly Stochastic oscillator at its overbought region. No change, maintain bearish bias with 1.3090 remains as the key short-term pivotal resistance for a further potential push down to retest the 25 Apr 2019 low of 1.2870 follow by 1.2800 next (lower boundary of the descending channel & Fibonacci retracement/expansion cluster).
- However, an hourly close above 1.3090 invalidates the bearish tone for a squeeze up towards the next intermediate resistance at 1.3190.
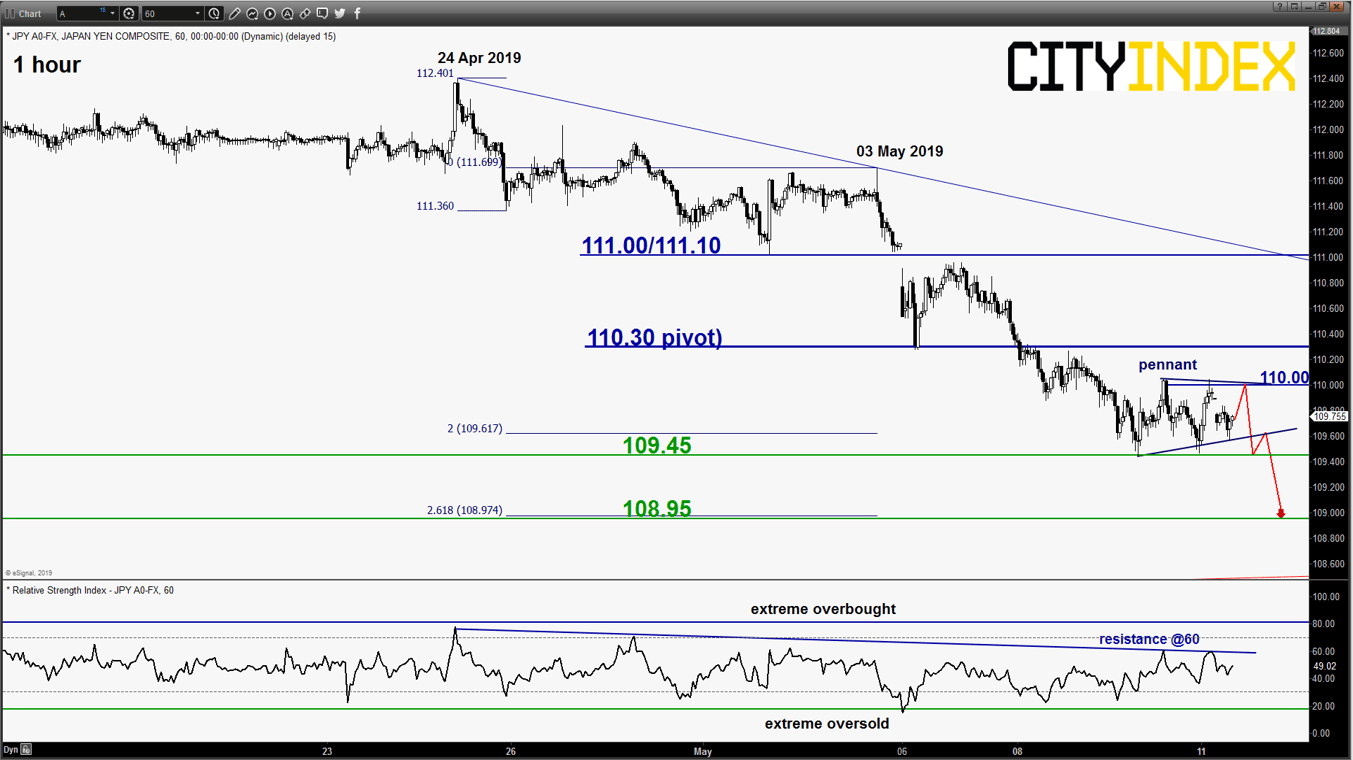
USD/JPY – 110.30 remains the key resistance to watch
click to enlarge chart
- Since last Thurs, 09 May low of 109.45, the pair has traded sideways with a 60 pips range and it has started to form a “Pennant” contracting range consolidation configuration below the 110.00 intermediate resistance. No change, maintain bearish bias with 110.30 remains the key short-term pivotal resistance and a break below 109.45 reinforces a further potential drop to target the next near-term support at 108.95 in the first step (Fibonacci expansion cluster & 31 Jan 2019 swing low area).
- However, an hourly close above 110.30 negates the bearish tone up towards the next intermediate resistance at 111.00/111.10 (06 May 2019 gapped down, pull-back resistance of the former ascending support from 03 Jan 2019 flash crash swing low area & descending trendline from 24 Apr 2019 high).
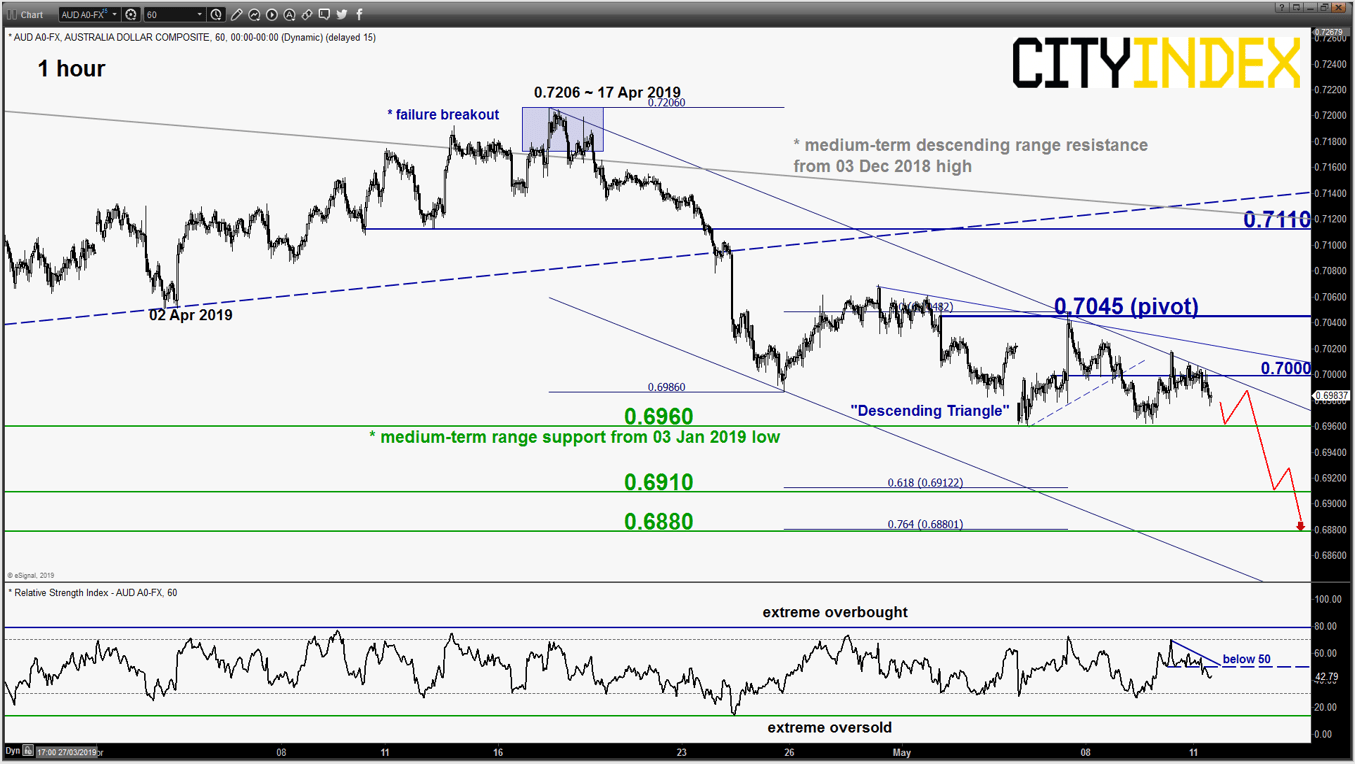
AUD/USD – Vulnerable for a bearish breakdown
click to enlarge chart
- Since the retest on the 0.6980/6960 medium-term range support in place since 03 Jan 2019 on last Mon, 06 May, its price action has evolved into a bearish “Descending Triangle” range configuration with intermediate resistance at 0.7000. No change, maintain bearish bias with 0.7045 remains as the short-term pivotal resistance (also the swing high formed post RBA) and a 4-hour close below 0.6960 reinforces a bearish breakdown below its medium-term range support to target the next near-term support at 0.6910 follow by 0.6880 next in the first step.
- However, an hourly close above 0.7045 invalidates the bearish tone for a squeeze up to retest the 0.7110 key medium-term resistance.
Charts are from eSignal
Latest market news
Today 08:33 AM
Latest Forex articles
Yesterday 04:47 AM
April 16, 2024 12:00 PM
April 16, 2024 04:24 AM