


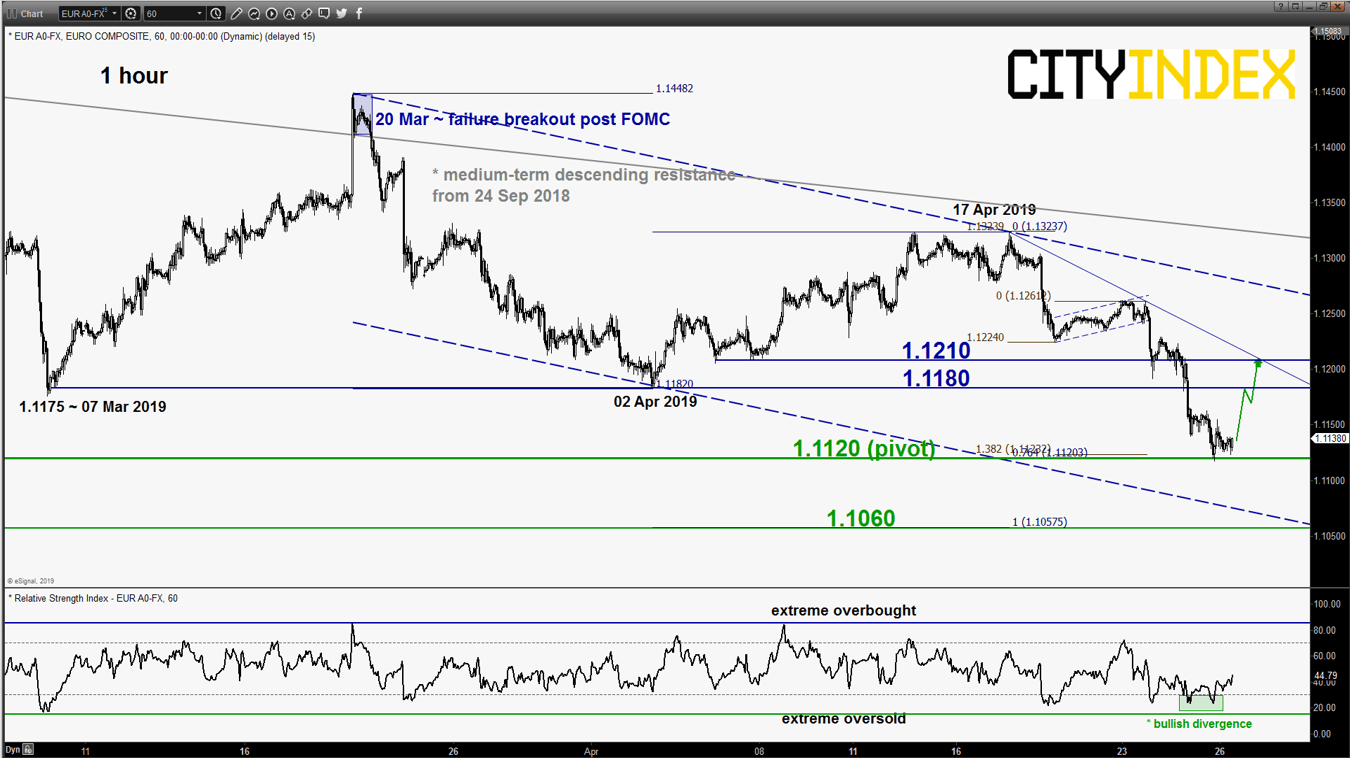
EUR/USD – Risk of shaping corrective bounce
click to enlarge chart
- Inched down lower as expected and hit the first near-term support/target of 1.1210 as per highlighted in our previous report (click here for a recap). Right now, short-term momentum indicator; the 1-hour RSI oscillator is indicating that the declined from 17 Apr 2019 high of 1.1323 is overstretched as it exited from its from oversold region after a prior bullish divergence signal. Flip to a bullish bias above 1.1120 key short-term pivotal support for a potential corrective bounce towards 1.1180 and 1.1210 intermediate resistances (Fibonacci retracement cluster, former swing low areas of 07 Mar/02 Apr 2018 & minor descending trendline from 17 Apr 2019 high) before another downleg materialises.
- On the other hand, an hourly close below 1.1120 sees the continuation of the down move to target the next near-term support at 1.1060 (1.00 Fibonacci expansion of the decline from 20 Mar 2019 high to 02 Apr 2019 low projected from 12 Apr 2019 high & lower boundary of a minor descending channel from 20 Mar 2019 high).
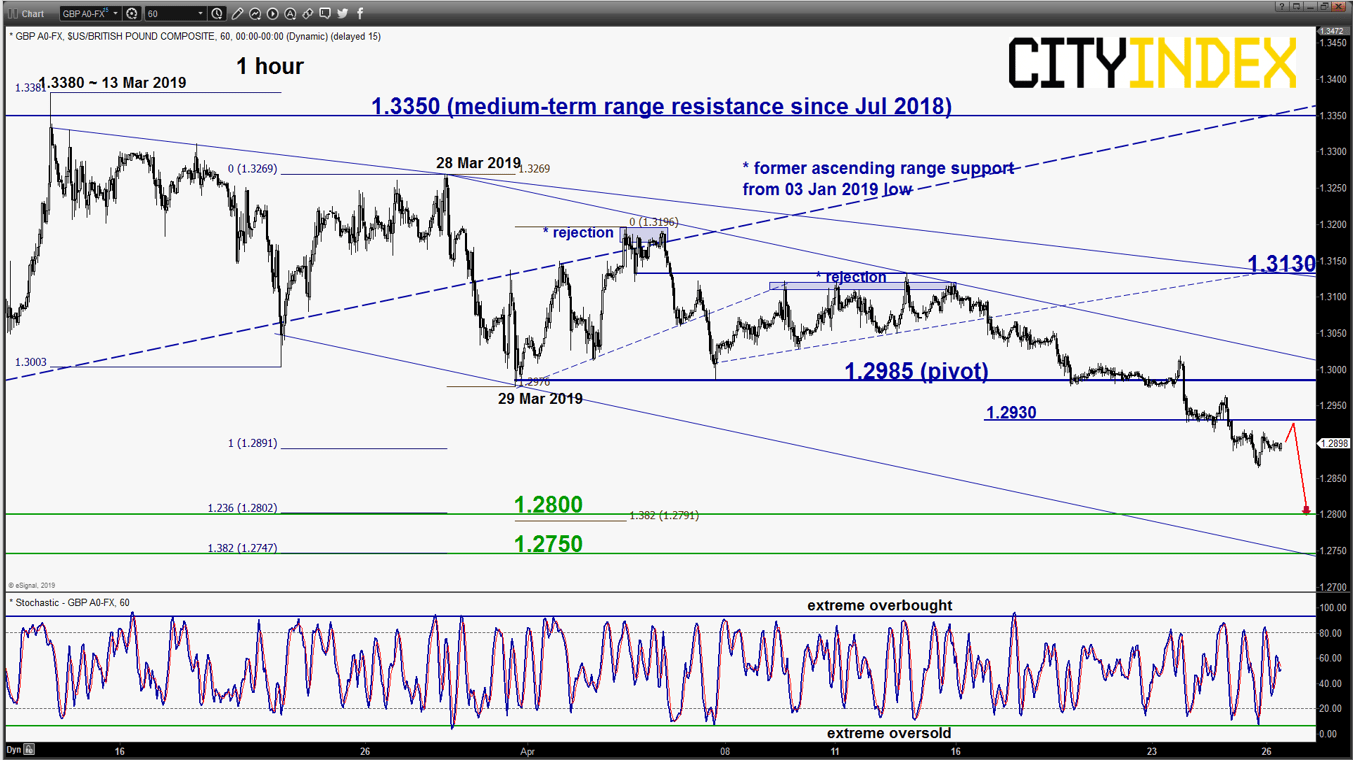
GBP/USD – Further potential push down in progress
click to enlarge chart
- Maintain bearish bias in any bounces below the 1.2985 key short-term pivotal resistance for another potential downleg to target the next near-term support at 1.2800 (61.8% Fibonacci retracement of 3-month up move from 03 Jan 2019 low to 13 Mar 2019 high, Fibonacci expansion cluster & 14 Feb 2019 swing low).
- On the other hand, an hourly close above 1.2985 negates the bearish tone for a squeeze up to retest the next intermediate resistance at 1.3130.
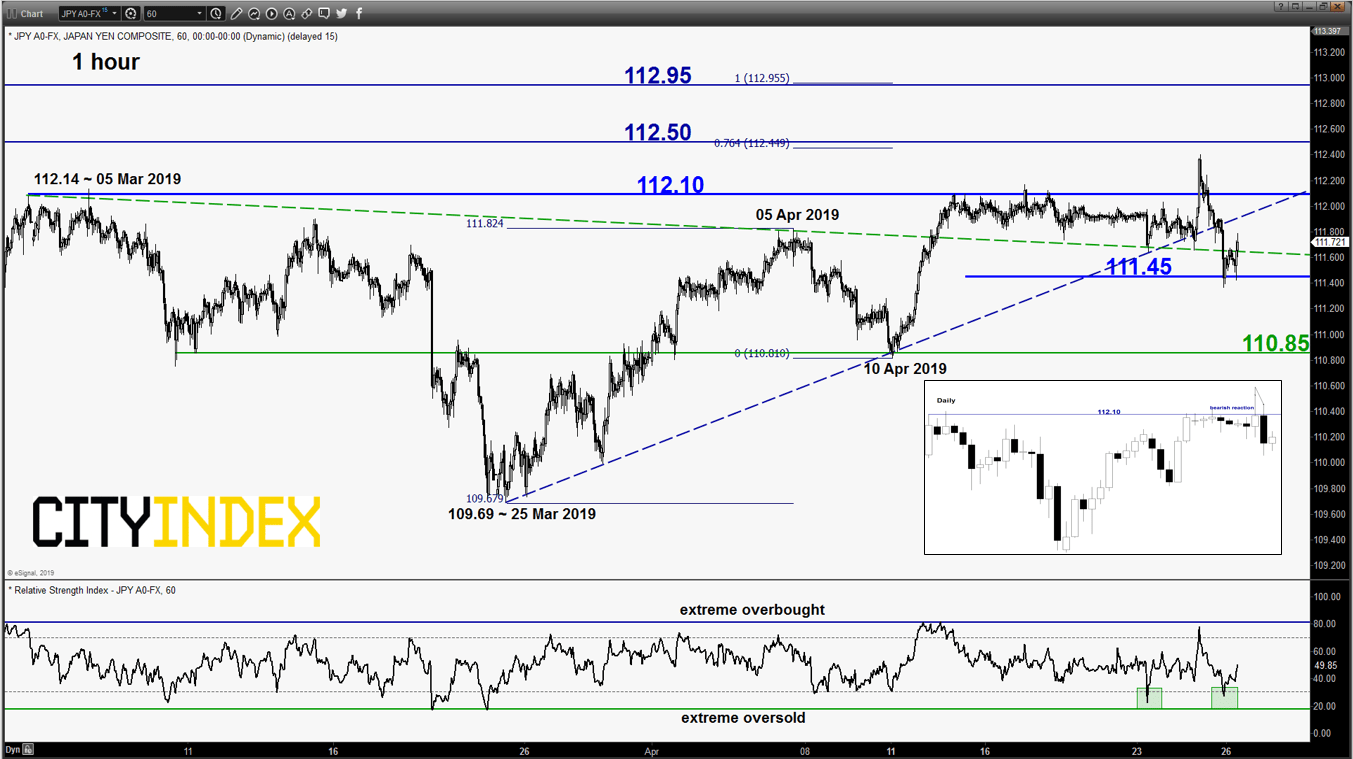
USD/JPY – Mix elements
click to enlarge chart
- Whipsawed around the 111.65 key short-term pivotal support after it broke below the minor ascending trendline support from 25 Mar 2019 low post BOJ monetary policy meeting. Mix elements now, prefer to turn neutral between 111.45 and 112.10. Do note that Japan will be heading to an extended Golden Week holiday from 27 Apr to 06 May 2019. Only a break above 112.10 revives the bullish tone for a rally towards 112.50 and 112.95.
- On the flipside, a break below 111.45 sees a further slide towards the next support at 110.85.
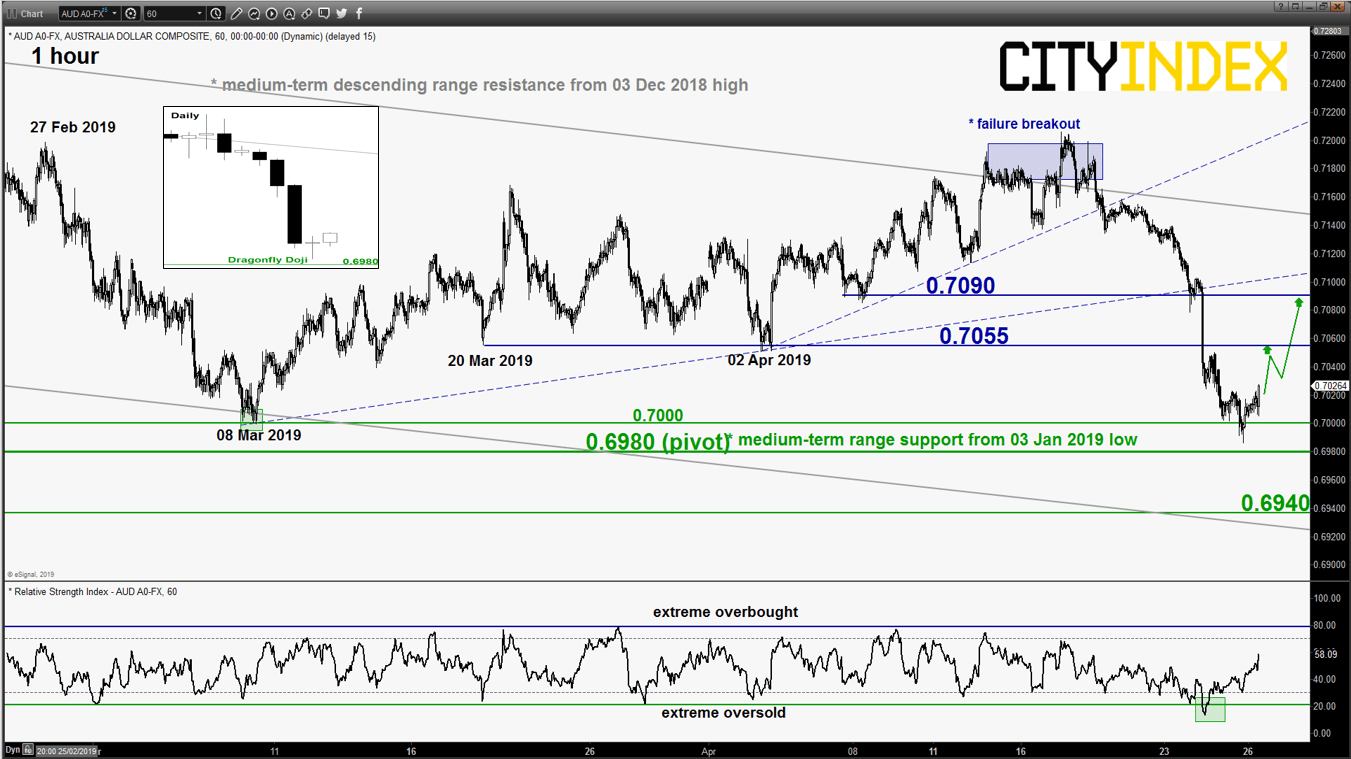
AUD/USD – Corrective bounce in progress
click to enlarge chart
- Managed to stage the expected bounce right above the 0.6980 key short-term pivotal support as per highlighted in our previous report. In addition, it has ended yesterday, 25 Apr U.S session with a daily bullish “Dragonfly Doji” candlestick pattern. Maintain bullish bias for a further potential push up to target the intermediate resistances at 0.7055 and 0.7090 next.
- On the other hand, an hourly close below 0.6980 invalidates the corrective bounce scenario for a continuation of the decline to target the next near-term support at 0.6940 in the first step.
Charts are from eSignal
Latest market news
Yesterday 01:23 PM
Yesterday 06:01 AM
April 18, 2024 11:27 PM
April 18, 2024 04:46 PM
Latest Forex articles
Yesterday 06:01 AM
April 17, 2024 02:40 PM
April 17, 2024 04:47 AM