


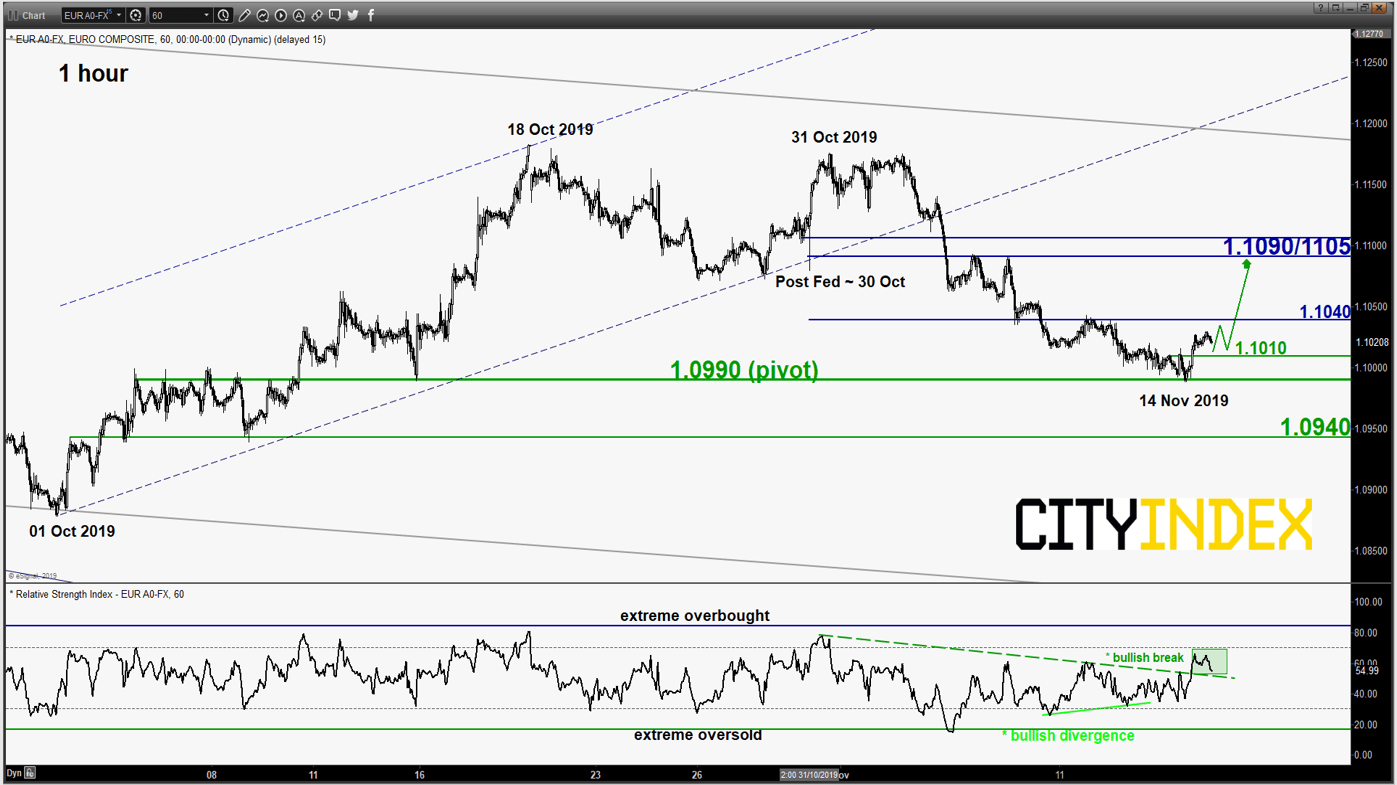
EUR/USD – Potential minor corrective bounce
click to enlarge chart
- In our previous report, we have turned neutral on the pair from an initial bearish bias due to mix elements.
- After a hovering around the lower limit of the neutrality zone at 1.1000 with a bullish break above the hourly RSI oscillator former descending resistance coupled with a prior bullish divergence signal, we flip to a bullish bias for a potential minor rebound to test the intermediate resistance zone at 1.1090/1105 (minor swing high area of 06/07 Nov 2019 & the 61.8% Fibonacci retracement of the decline from 31 Oct high to 14 Nov 2019 low).
- On the other hand, a an hourly close below 1.0990 sees a further drop towards 1.0940 (also the 76.4% Fibonacci retracement of the recent up move from 01 Oct low to 18 Oct 2019 high).
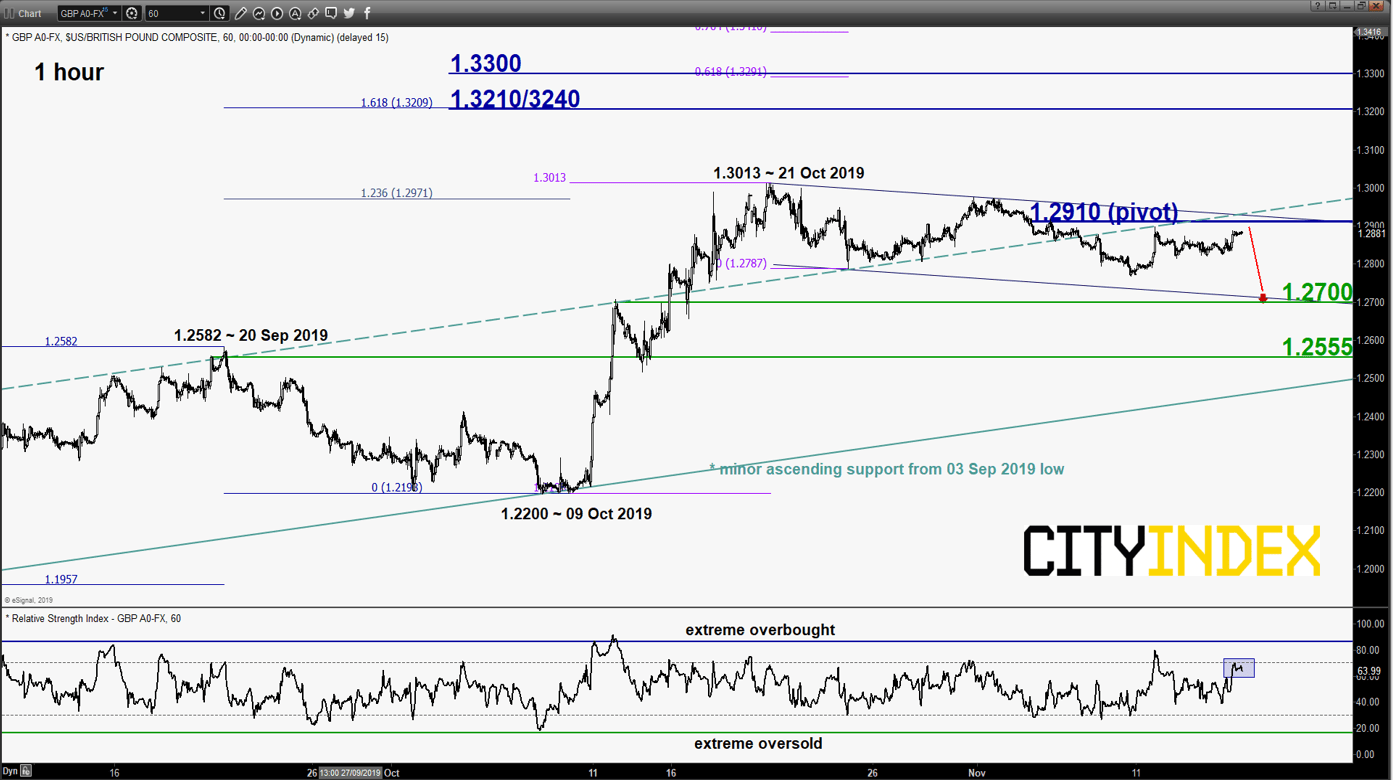
GBP/USD – 1.2910 remains the key resistance to watch
click to enlarge chart
- The pair has continued to churn higher but remains below the 1.2910 key short-term pivotal resistance with hourly RSI oscillator at its overbought region.
- Maintain bearish bias for a further potential drop to target the near-term support at 1.2700 (lower limit of a minor descending range configuration from 21 Oct 2019 swing high & 38.2% Fibonacci retracement of the recent up move from 09 Oct low to 21 Oct 2019 high).
- However, a clearance with an hourly close above 1.2910 revives the bullish tone for a continuation of the corrective upleg sequence within a major range configuration to target next intermediate resistance at 1.3210/3240 (03 Apr/03 May 2019 swing high area & Fibonacci expansion).
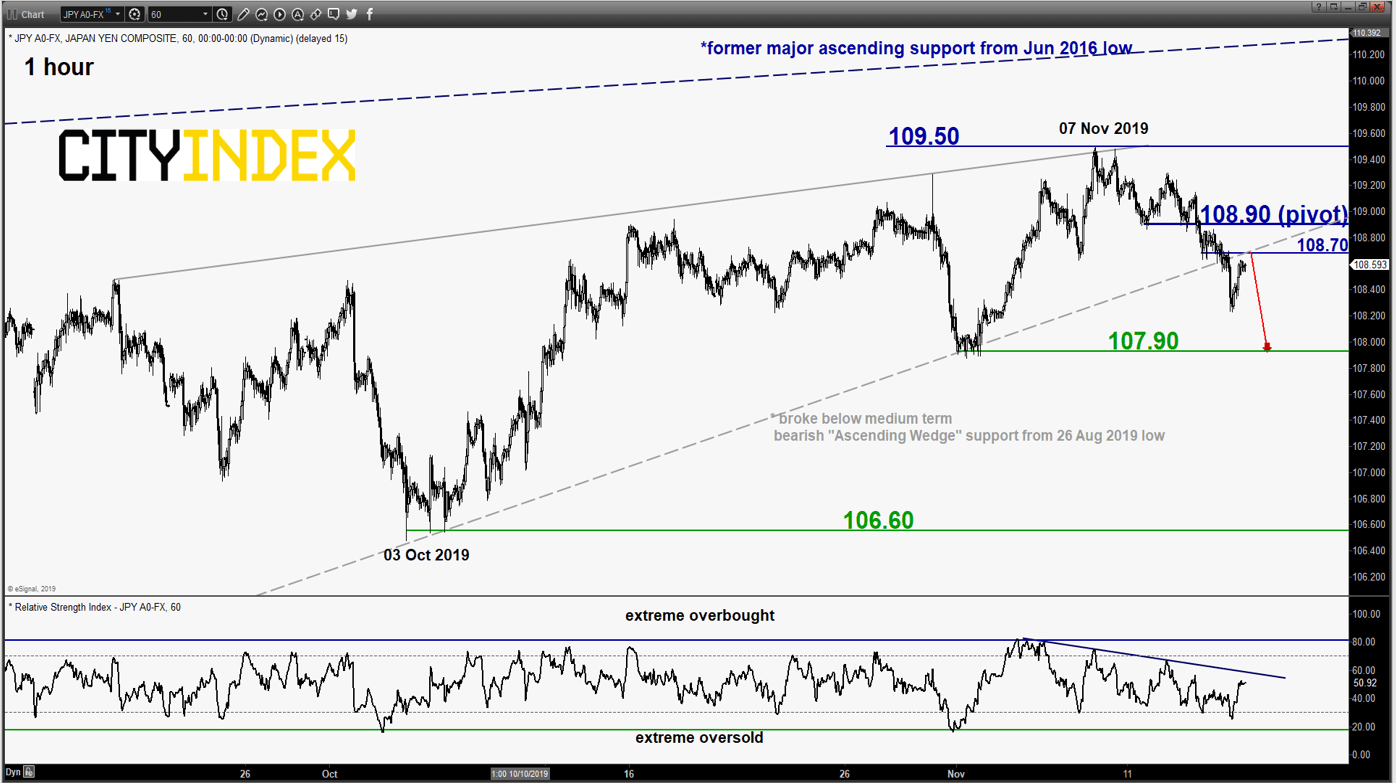
USD/JPY – Retesting pull-back resistance of former Ascending Wedge support
click to enlarge chart
- The pair has drifted down lower as expected and broke below the medium-term “Ascending Wedge” support from 26 Aug 2019 low. Maintain bearish bias with a tightened key short-term pivotal resistance now at 108.90 (former minor swing low areas of 11/13 Nov 2019 & 61.8% Fibonacci retracement of the recent slide from 12 Nov high to yesterday, 14 Nov U.S. session low of 108.22) for a further potential drop towards 107.90 near-term support in the first step.
- On the other hand, a clearance with an hourly close above 108.90 negates the bearish tone for a squeeze up to retest the 07/08 Nov 2019 swing high area at 109.50.
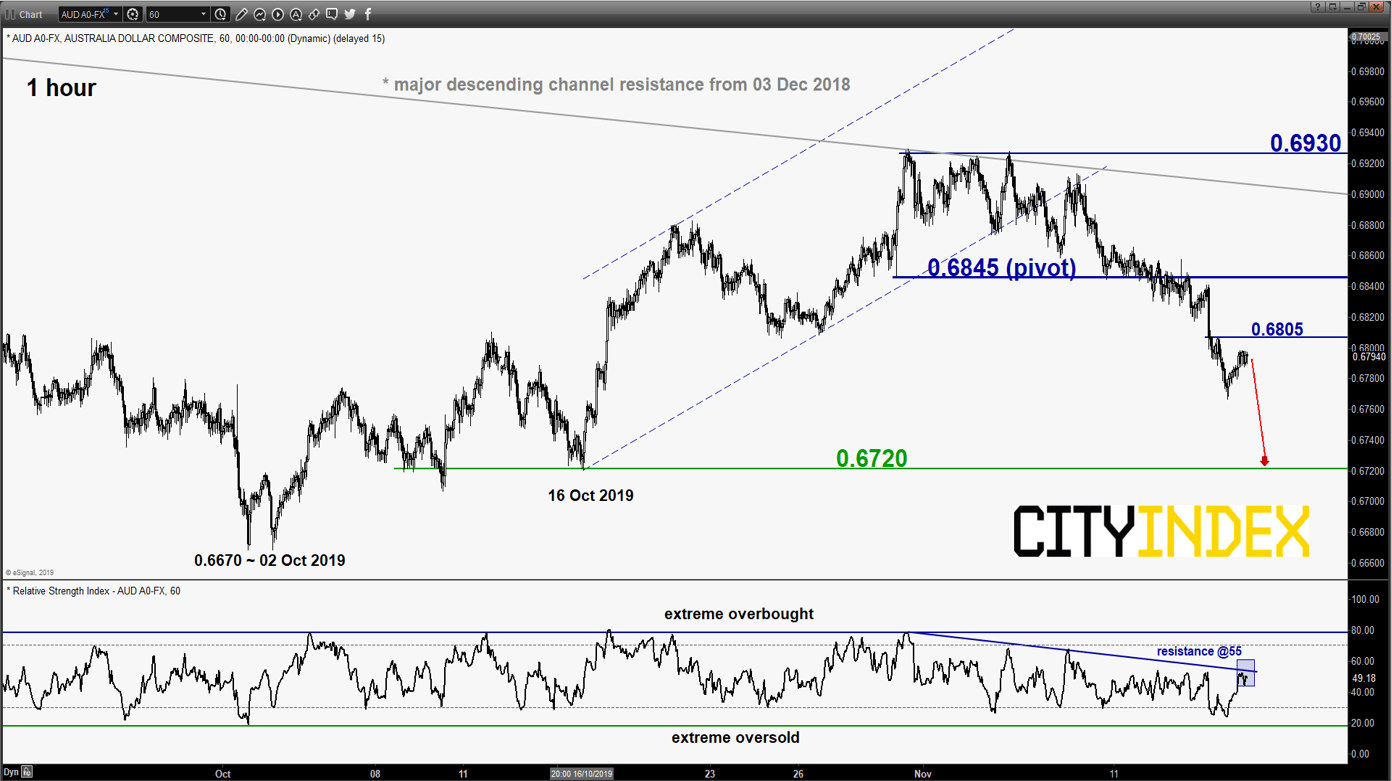
AUD/USD – Further potential drop
click to enlarge chart
- The pair has drifted down lower and hit the first short-term target/support of 0.6800. Maintain bearish bias below a tightened key short-term pivotal resistance now at 0.6845 (former minor congestion area of 09/13 Nov & minor descending resistance from 05 Nov 2019 high) for a further potential push down to target the next near-term support at 0.6720 (minor swing area of 16 Oct 2019 and the 76.4% Fibonacci retracement of the recent rebound from 02 Oct low to 31 Oct 2019 high).
- On the other hand, a clearance with an hourly close above 0.6845 negates the bearish tone for squeeze up to retest 0.6900/6930 (range resistance of 31 Oct/05 Nov 2019 & the major descending channel resistance from 03 Dec 2018 high).
Charts are from eSignal
Latest market news
Yesterday 03:30 PM
Yesterday 01:23 PM
Yesterday 11:00 AM
Yesterday 08:15 AM
Latest EUR articles
April 13, 2024 08:00 PM
March 25, 2024 02:55 AM
January 22, 2024 04:19 AM
January 18, 2024 04:46 AM