


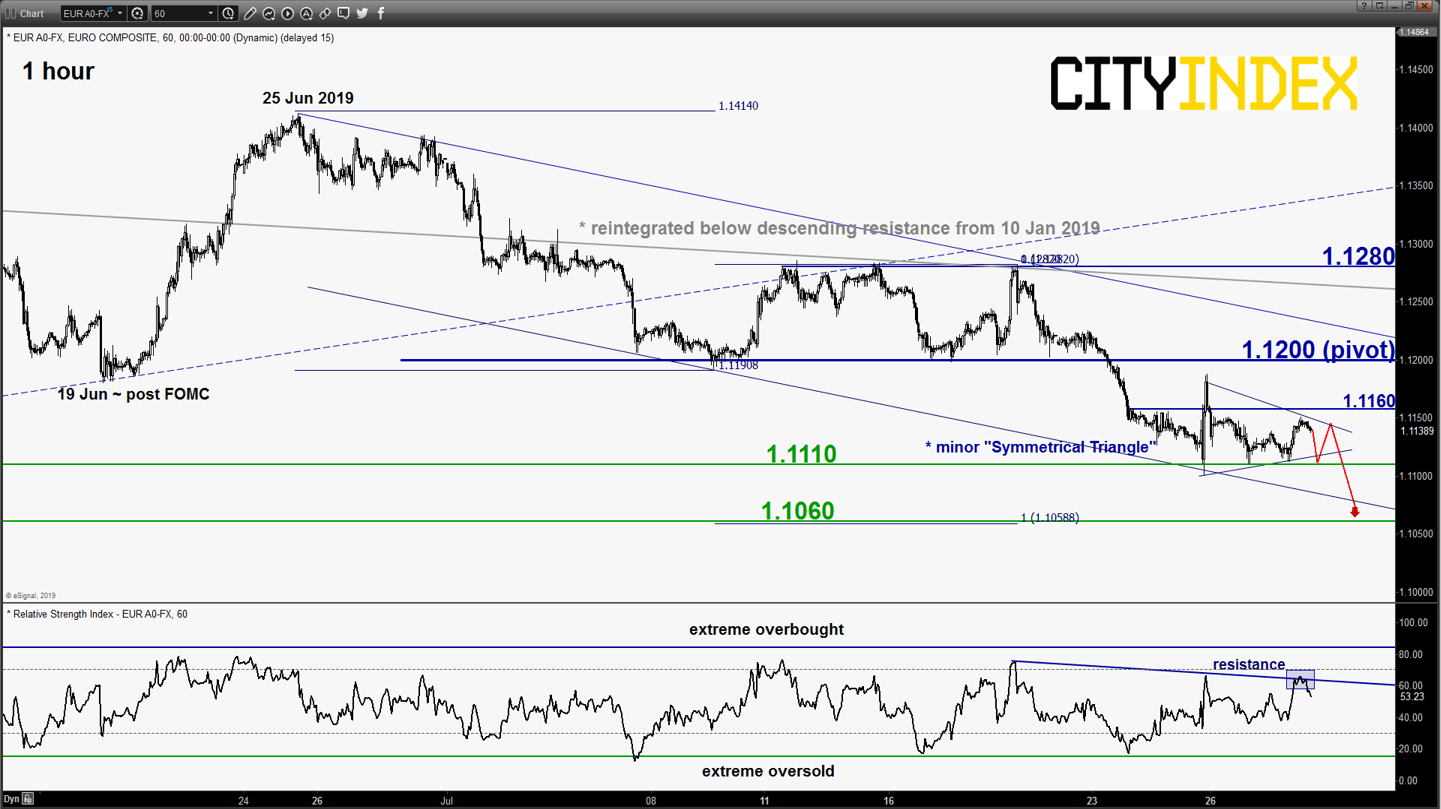
EUR/USD – Minor bearish trend remains intact
click to enlarge chart
- Since 25 Jul 2019 post ECB low of 1.1100, the pair has continued to trade sideways within a minor “Symmetrical Triangle” range configuration. No major changes on its key short-term elements; maintain bearish bias in any bounces below 1.1200 key short-term pivotal resistance for another potential downleg to target the next near-term support at 1.1060.
- However, a break with an hourly close above 1.1200 negates the bearish tone for an extension of the corrective rebound towards the 1.1280 key medium-term resistance (also close to the descending resistance from 10 Jan 2019 high).
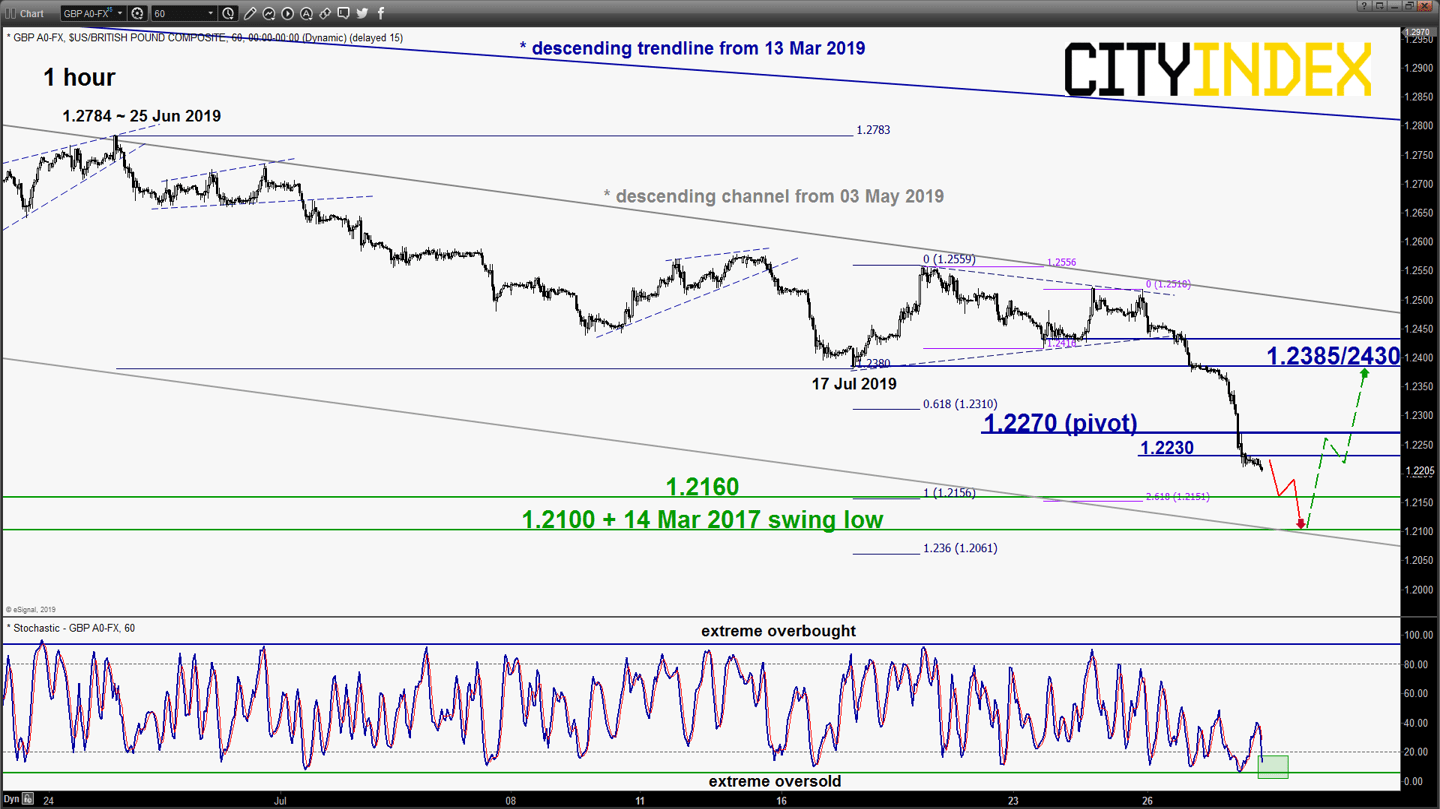
GBP/USD – Residual push down before risk of minor corrective bounce
click to enlarge chart
- The pair has staged the expected bearish breakdown from its prior minor “triangle range” configuration and tumbled towards the short-term downside target/support of 1.2230 as per highlighted in our previous report (click here for a recap).
- Based on Elliot Wave/fractal analysis coupled with an extreme oversold reading seen in the hourly Stochastic oscillator, the pair may stage a residual push down to target 1.2160 follow by 1.2100 (Fibonacci projection cluster & lower boundary of a medium-term descending channel from 03 May 2019 high) holding below the 1.2270 tightened key short-term pivotal resistance before a potential minor corrective rebound materialises.
- However, a break with an hourly close above 1.2270 invalidates the residual push down scenario to open up scope a corrective rebound towards 1.2385/2430.
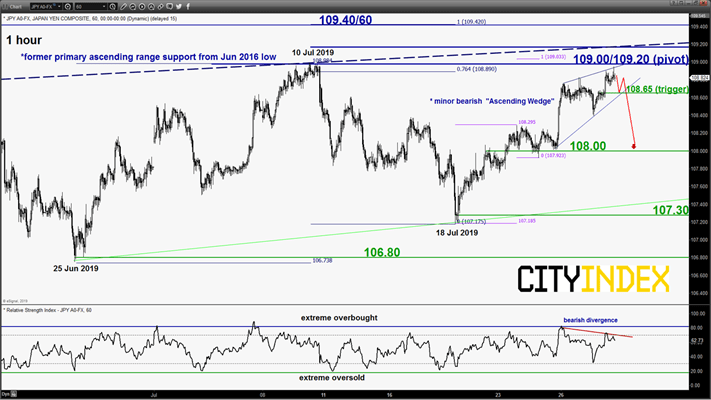
USD/JPY – Bounce target reached with bearish elements
click to enlarge chart
- The pair has staged the expected rebound towards the corrective bounce target of 108.60/109.00 as per highlighted in our previous report.
- Right now, it is coming close to the key medium-term resistance of 109.00/109.20; the former primary ascending range support from Jun 2016 low and a Fibonacci retracement/projection cluster coupled with an easing short-term upside momentum in price action as indicated by the bearish divergence seen in the hourly RSI oscillator in the overbought region.
- Flip to back to a bearish bias with 109.20 as key pivotal resistance and an hourly close below 108.65 (minor “Ascending Wedge” support) is likely to reinforce the start of another potential impulsive downleg to target the next near-term support at 108.00 in the first step.
- However, a break with a daily close above 109.20 invalidates the bearish scenario for a squeeze up towards 109.40/60 (30 May 2019 swing high area).
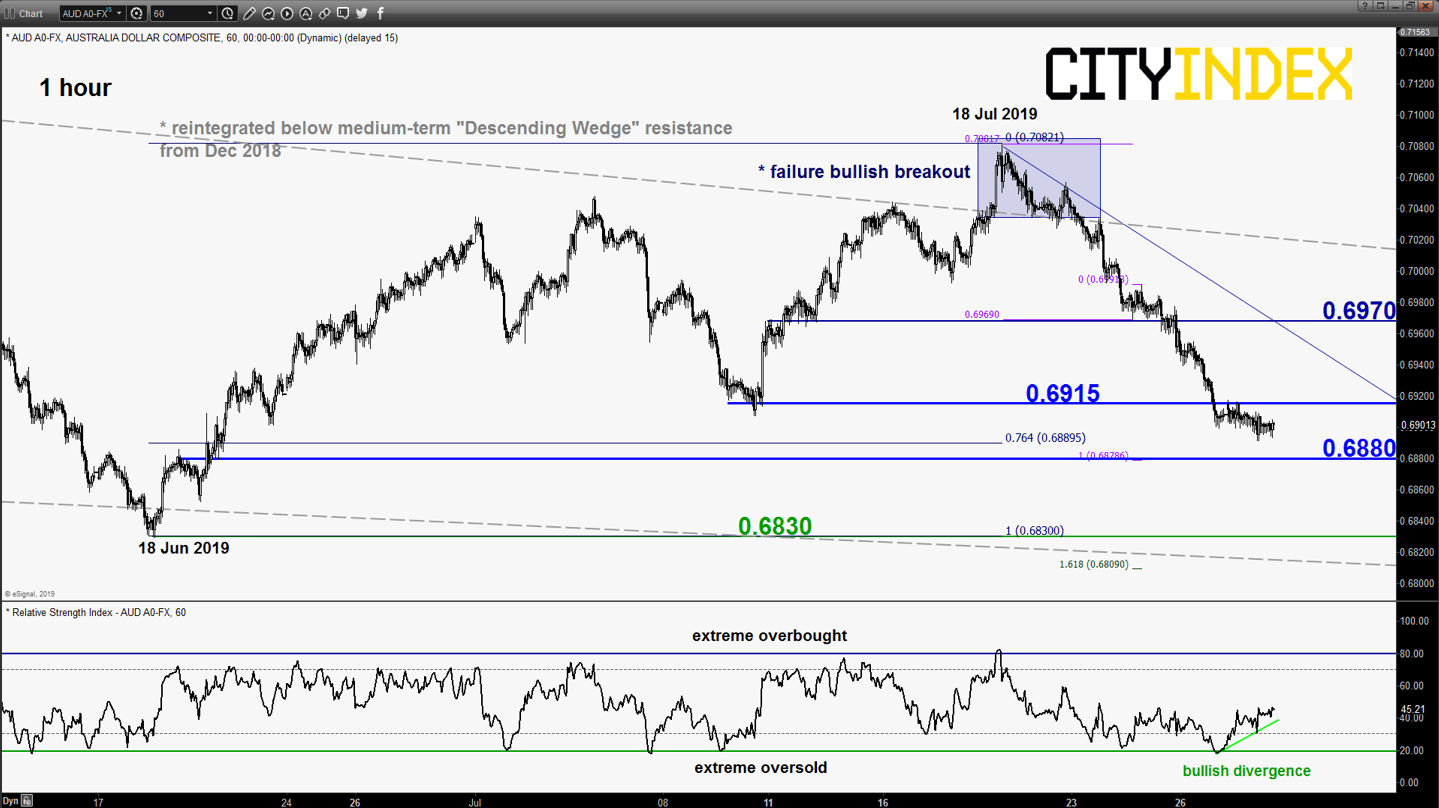
AUD/USD – Downside target reached, mix elements
click to enlarge chart
- The pair has dropped as expected and hit the 0.6910 short-term downside target/support of 0.6910 as per highlighted in our previous report. Mix elements at this juncture; prefer to turn neutral now between 0.6915 and 0.6880. An hourly close above 0.6915 sees a minor corrective rebound towards 0.6970 intermediate resistance.
- On the flipside, a break with an hourly close below 0.6880 sees the continuation of the decline to retest 18 Jun 2019 swing low of 0.6830.
Charts are from eSignal
Latest market news
Today 11:14 AM
Today 08:28 AM
Yesterday 03:30 PM
Latest EUR articles
April 13, 2024 08:00 PM
March 25, 2024 02:55 AM
January 22, 2024 04:19 AM
January 18, 2024 04:46 AM