


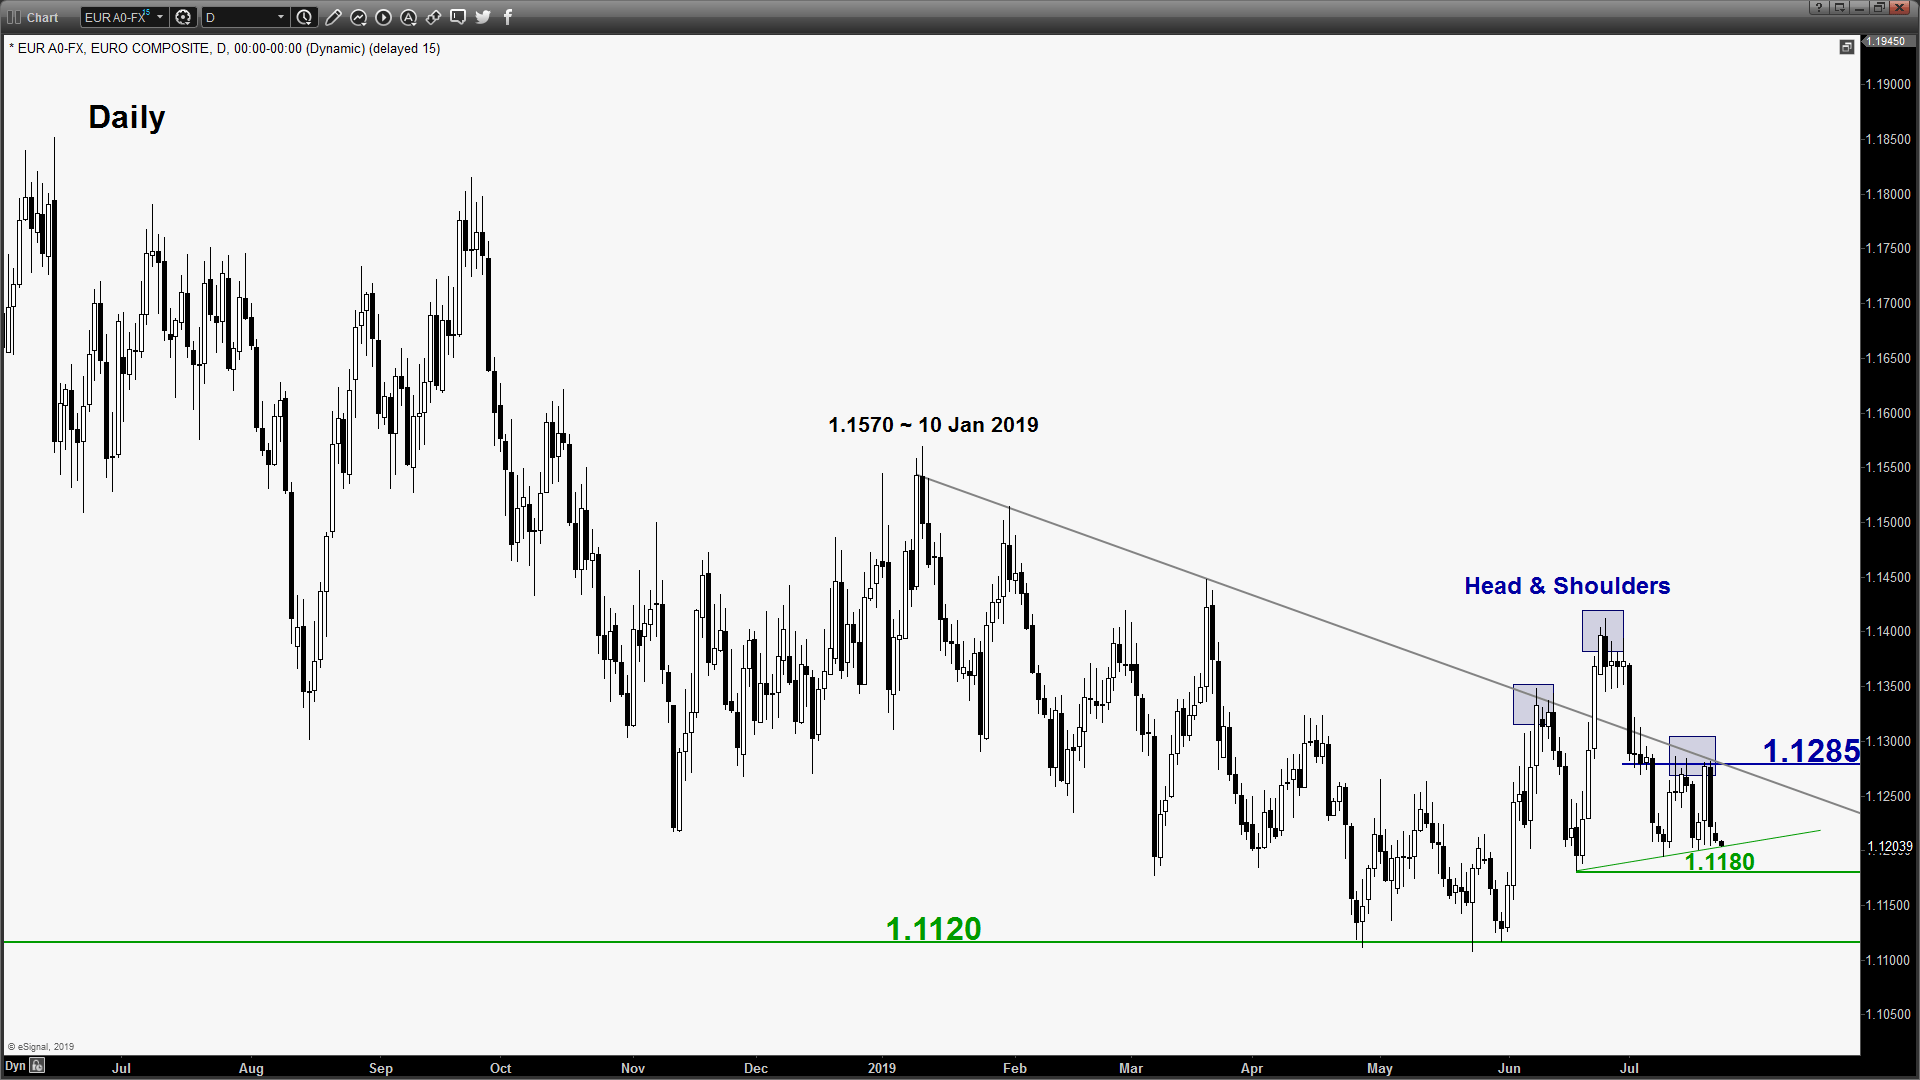
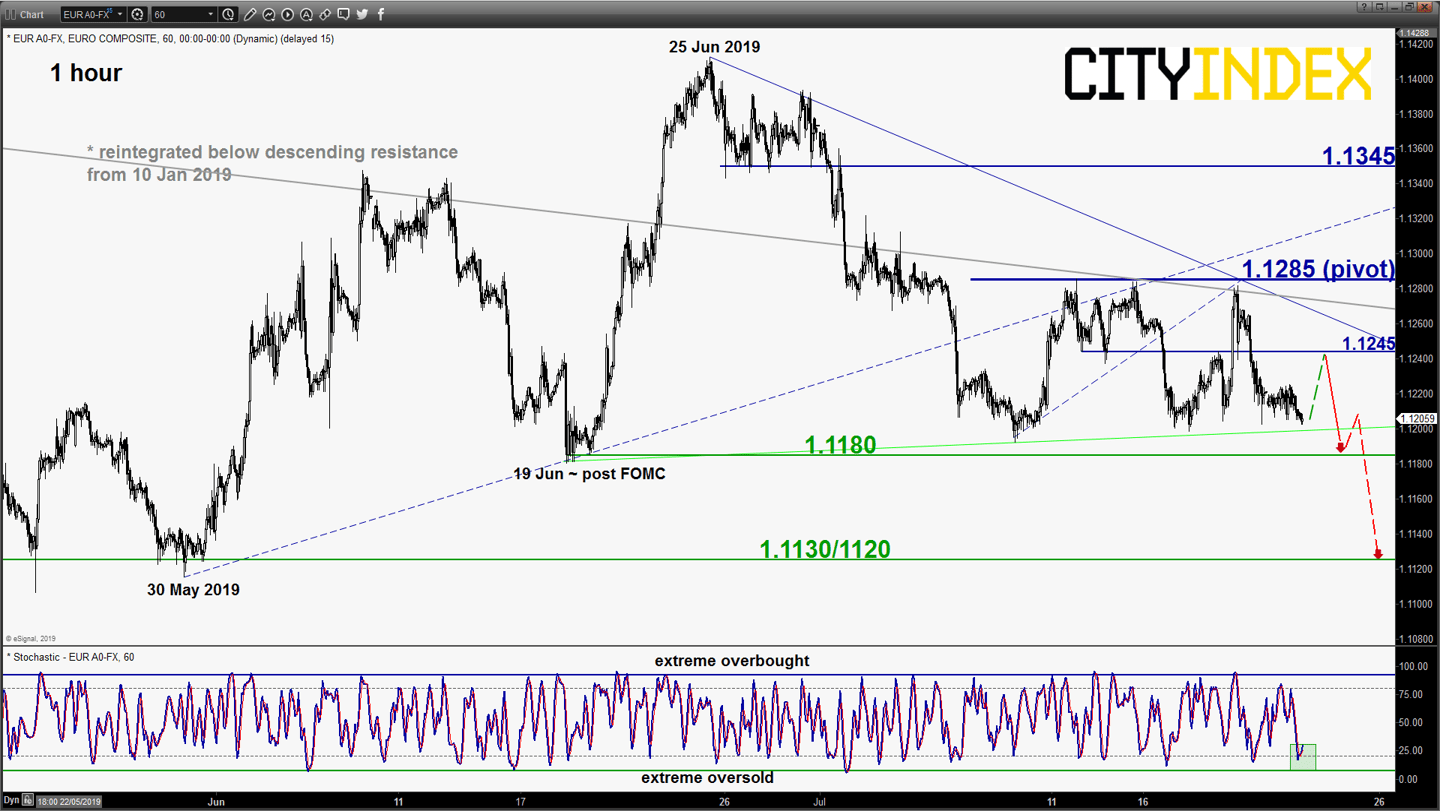
EUR/USD – Push down to retest range support
click to enlarge charts
- The pair has broken below the 1.1240 lower limit of the short-term neutrality zone as per highlighted in our previous report (click here for a recap). As the hourly Stochastic oscillator has started to inch up from an extreme oversold level, the pair may stage a bounce at this juncture back towards the 1.1245 intermediate resistance.
- Flip to a bearish bias in any bounces below the 1.1285 short-term pivotal resistance for another round of potential push down to retest the 1.1180 neckline support of the “Head & Shoulders” configuration and below exposes the 1.1130/1120 medium-term range support. On the other hand, an hourly close above 1.1285 sees an extension of the corrective rebound towards the 1.1345 intermediate resistance.
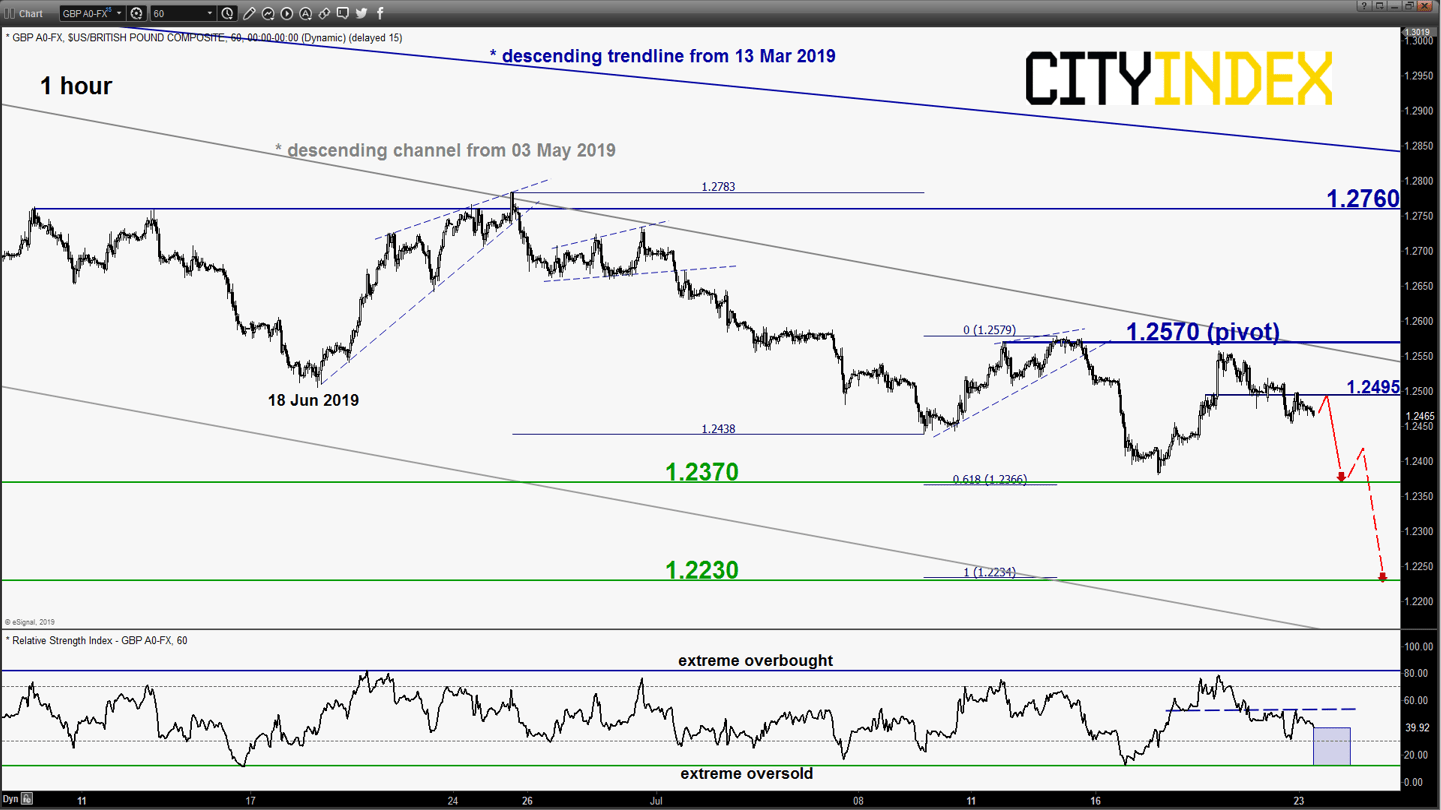
GBP/USD – Drop in progress
click to enlarge chart
- Pushed down as expected and hit the first short-term downside target/support of 1.2450 as per highlighted in our previous report. Maintain bearish bias in any bounces below 1.2570 pivotal resistance for a further potential push down to target the next supports at 1.2370 follow by 1.2230 next.
- On the other hand, an hourly close above 1.2570 invalidates the bearish tone for an extension of the corrective rebound towards 1.2760 range resistance.
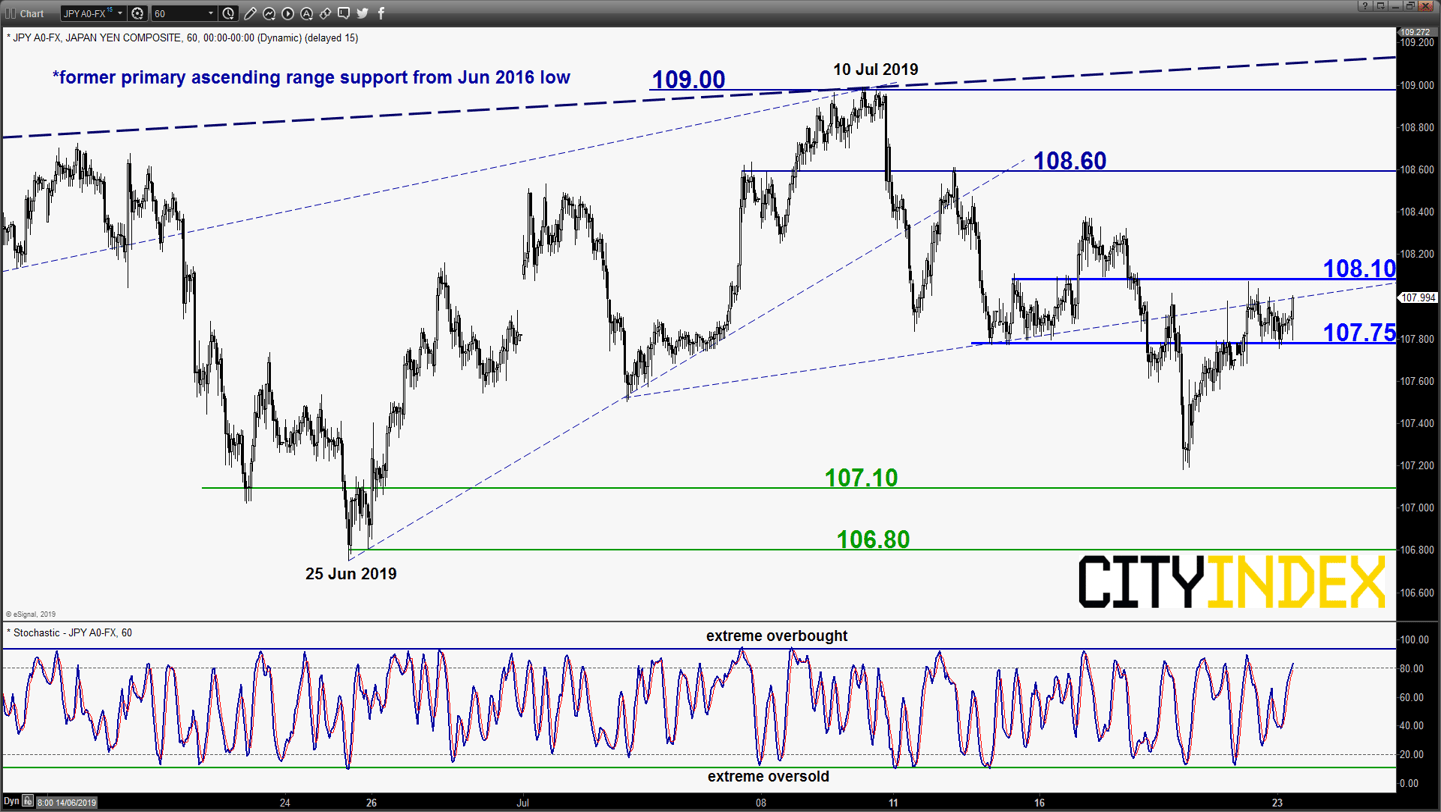
USD/JPY – Sideways
click to enlarge chart
- The pair pushed up and challenged the 107.95 short-term pivotal resistance (printed a high of 108.07 in yesterday, 22 Jul U.S. session before an hourly close back at 107.95).
- Mix elements now, prefer to turn neutral between 108.10 and 107.75. Bears need to break and have an hourly close below 107.75 to reinstate a potential drop towards the 107.10 minor support in the first step. On the flipside, a clearance with an hourly close above 108.10 sees a squeeze up towards 108.60 with a maximum limit set at the 109.00 key medium-term resistance.
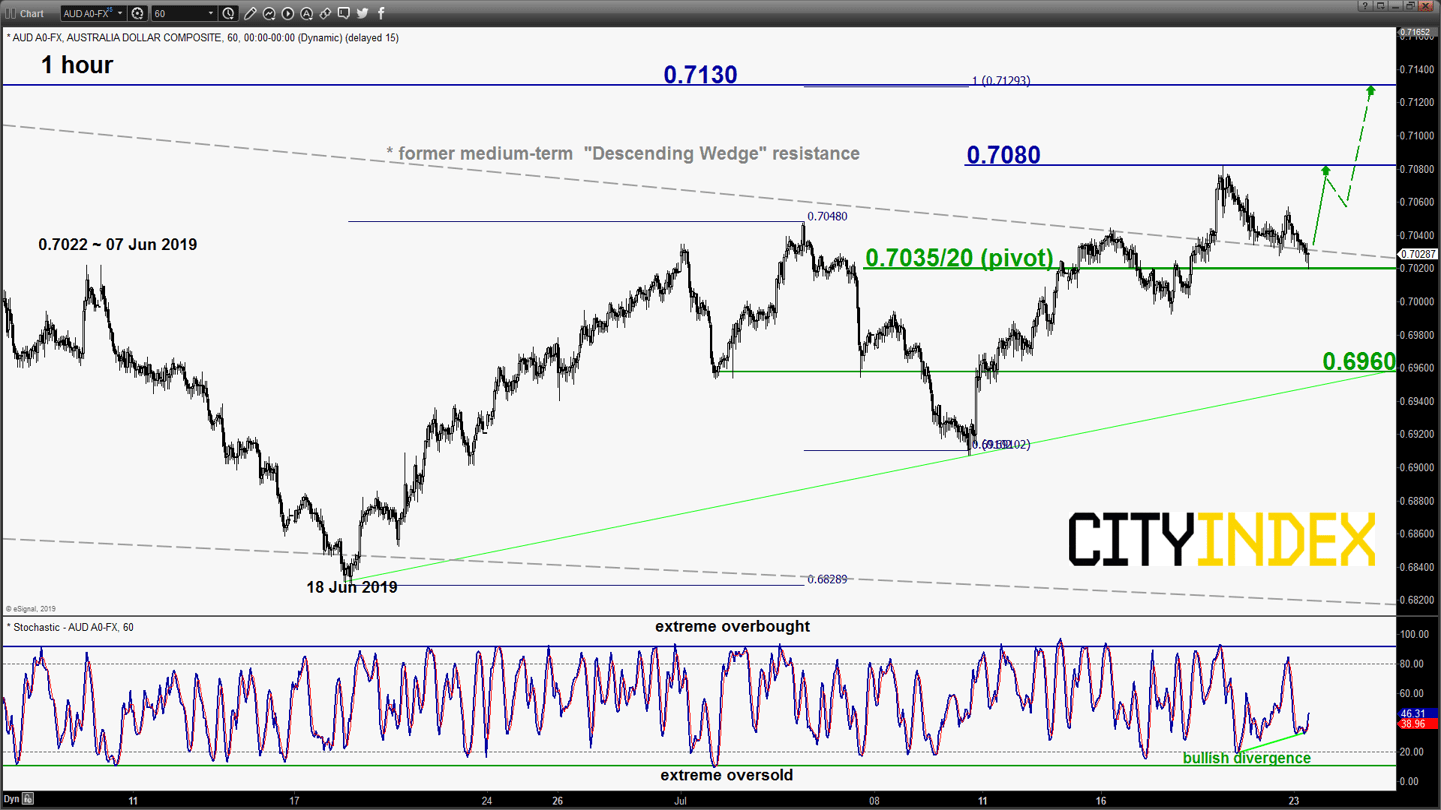
AUD/USD – Watch the 0.7035/7020 key support
click to enlarge chart
- The pair has pull-backed towards the 0.7035 key short-term pivotal support as per highlighted in our previous report which is also the former medium-term “Descending Wedge” resistance from Dec 2018.
- The hourly Stochastic oscillator has shaped a bullish divergence signal which suggests a slowdown in the recent downside momentum. Tolerate the excess to 0.7020 and maintain the bullish bias for a potential upleg to retest the 0.7080 minor swing high before targeting the next resistance at 0.7130.
- On the other hand, a break with an hourly close below 0.7020 indicates a failure bullish breakout for a slide back towards 0.6960 in the first step.
Charts are from eSignal
Latest market news
Today 08:15 AM
Today 05:45 AM
Yesterday 11:09 PM
Yesterday 11:01 PM
Latest EUR articles
April 13, 2024 08:00 PM
March 25, 2024 02:55 AM
January 22, 2024 04:19 AM
January 18, 2024 04:46 AM