Crude oil bottom in sight
Both oil contracts ended lower last week with Brent falling for a third time and WTI snapping a two-week winning streak. Prices extended their declines […]
Both oil contracts ended lower last week with Brent falling for a third time and WTI snapping a two-week winning streak. Prices extended their declines […]
Both oil contracts ended lower last week with Brent falling for a third time and WTI snapping a two-week winning streak. Prices extended their declines at the start of this week and traded mixed on Tuesday’s session with WTI edging slightly higher and Brent lower. In addition to the still-weak fundamental factors, oil prices are prevented from rising more notably because of the renewed strength of the US dollar, which rose on Tuesday despite the release of mostly disappointing macroeconomic data. US retail sales, industrial production, capacity utilization, business inventories and Empire State manufacturing index all disappointed expectations. Yet, the dollar was able to regain its poise and this undermined some dollar-denominated commodities like gold and silver and limited the upside for WTI.
Nevertheless, both oil contracts remain above their August lows, keeping bullish hopes alive that prices may have bottomed, even if the probability of such scenario may have diminished given the lack of further follow-up buying after that late August rally. The bulls would argue that oil prices at these depressed levels cannot be sustained. After all, oil production in the US may have peaked and could decline next year, pointing to a more balanced market, while most of the bearish news is probably also now priced in. Indeed, the International Energy Agency (IEA) envisages the “largest cut in non-OPEC supply in more than two decades,” and expects US oil production to decline by 400,000 barrels per day in 2016. Although the OPEC expects non-OPEC supply to actually increase next year, it nevertheless thinks the rise will only total 160,000 barrels per day. Meanwhile the renewed falls in the US rig count as reported by Baker Hughes also point to an imminent production decrease there. Rig counts had fallen by a further 10 rigs last week following a decline of 13 the week prior.
On the demand side of the equation, although the IEA has again raised its global demand forecasts, the other leading agencies including the EIA and OPEC have both reduced theirs slightly. This, along with the soft patch in global economic data and the excessive supply of oil continues to exert pressure on prices in the near-term. Sentiment has been hurt further after the EIA reported another sharp build in US stockpiles last week and Goldman Sachs warned that crude prices could collapse to $20 a barrel due to massive oversupply. This week’s inventories reports by the American Petroleum Institute (Tuesday evening) and EIA (Wednesday afternoon) may show further increases in US stockpiles because of potentially lower gasoline demand now that the US summer driving season has unofficially ended. But as ever, the market’s response to the news may be more important than the news itself. If prices rally (fall) despite a sharp build (draw), then that could be a sign for things to come for the remainder of the week.
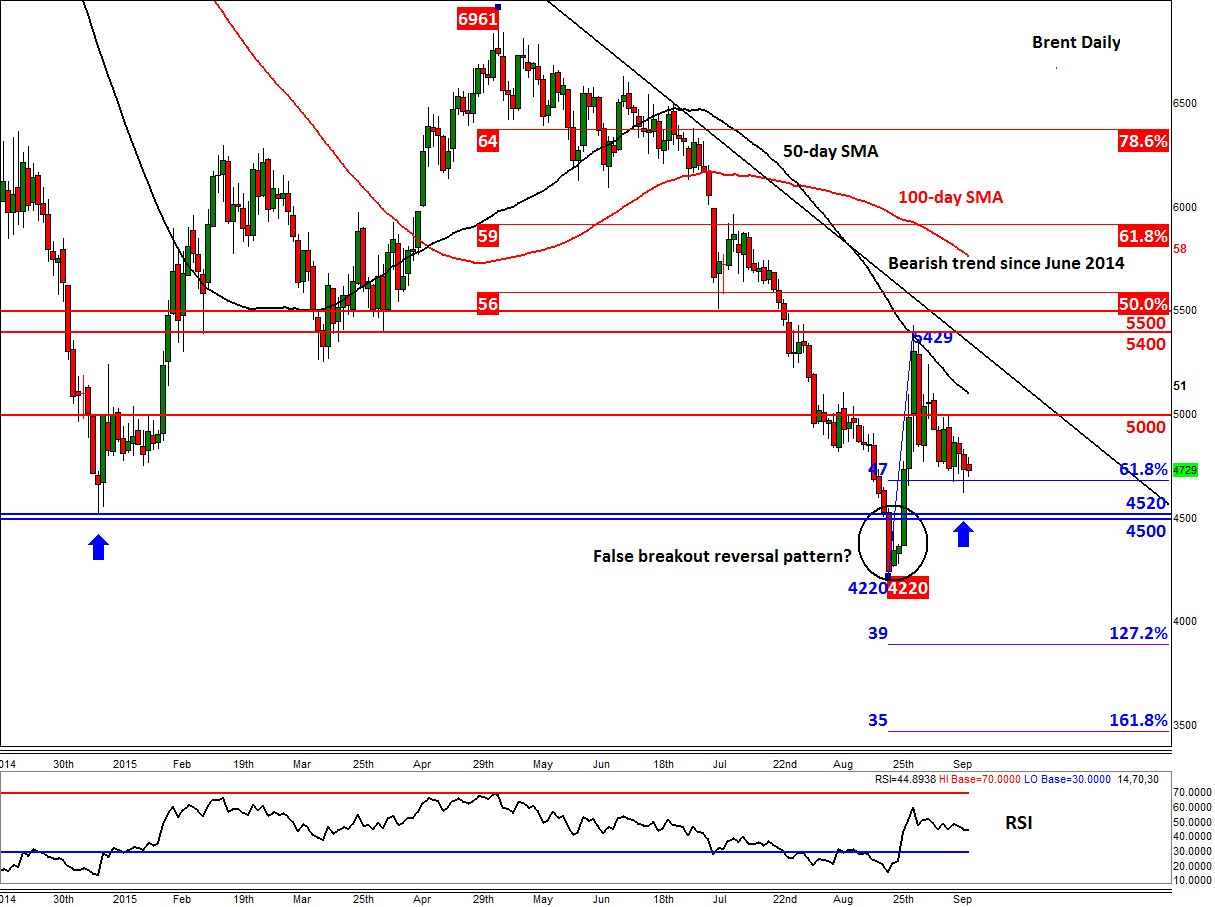
Meanwhile from a technical point of view, crude oil may have already formed a base when prices formed apparent false breakdown reversal patterns below their prior 2015 lows: Brent’s brief stint below the $45 handle and WTI’s short stay beneath $42.00. A false breakout pattern clearly shows the lack of willingness from traders to commit fresh funds at extreme levels, such as those just mentioned. Typically when this pattern first forms, prices stage sharp counter-trend moves that lasts for several days before going into consolidation and then the trend reverses for good. In the case of oil, prices rallied a good 25% off their lows before both contracts lost steam around their respective 50-day moving averages. Oil prices have since been falling but still remain comfortably above their August lows.
Now that we have seen deep price retracements, we are potentially getting closer to the key turning points for crude oil. In fact, Brent may have already reached this turning point around $46.75 per barrel. As can be seen from the chart, this level corresponds with the 61.8% Fibonacci retracement of the most recent upswing. If we have indeed seen a bottom for oil, Brent will need to hold above this level now. Even if it drops a little bit further, the abovementioned bullish setup would still remain valid. However, a closing break below the previous support at $45 would invalidate the signal. Crude oil bulls will also want to see the breakdown of some key resistance levels, starting with $50 on Brent. Thereafter the next key resistance is at around $54/55 which in addition to be being formerly support/resistance, corresponds with the bearish trend line that has been in place since June 2014. A potential break above that area would target the 61.8% Fibonacci retracement of the downward move from May, at $59, followed by the May high itself of around $69.60 a barrel. The bears meanwhile will now want to see Brent below the $45.00 handle. If realised, a move down towards at least the August low of $42.20 would then become very likely. The next potential target for the bears would be the psychological level of $40 a barrel.
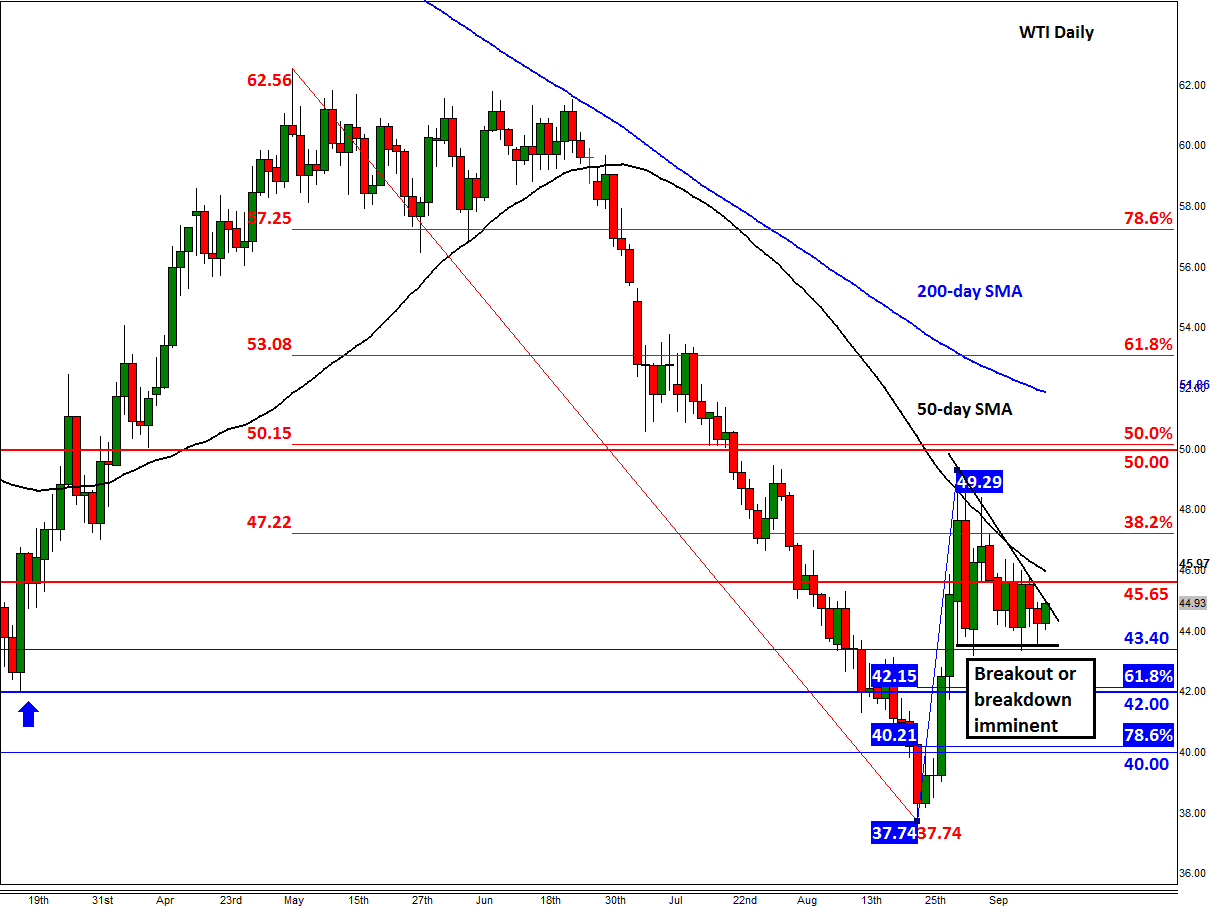
For WTI, a breakout or breakdown is imminent as it consolidates inside converging trend lines. Given the above fundamental backdrop and the late august rally, we would not be surprised if WTI breaks to the upside. The first levels of resistance are at $45.65 followed by the 50-day average at $46.00. Thereafter, not much resistance is seen until all the way at $50. On the downside, the prior 2015 low and 61.8% Fibonacci retracement at around $42 is the key support to watch – closing break below here would be a very bearish development.