


June 30, 2022 4:33 PM
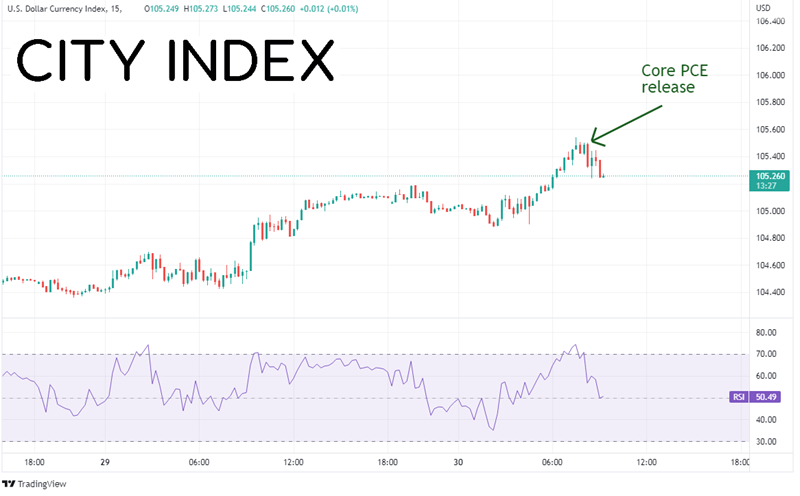
The US Core PCE Price Index has traditionally been known as the Fed’s favorite measure of inflation. Today, the US released the print for May with a reading of 4.7% YoY vs an expectation of 4.8% YoY and an April reading of 4.9% YoY. This is the third month in a row of declines for the reading and the lowest since November 2021. In addition, the headline PCE Price Index was 6.3% YoY vs a previous reading of 6.3% YoY.
So, is the Core PCE Price Index giving us a sign that we have had peak inflation? Fed Chairman Powell said in the press conference following the last FOMC meeting that the main reason for hiking interest rates 75bps, rather than the expected 50bps, was because of the 8.6% YoY CPI reading, as well as the higher than expected Michigan Inflation Expectations prints. This leads us to believe that although the Core PCE is still in the mix as one of the measures the Fed will use to determine inflation levels, it may not be the holy grail of inflation readings as it was in the past.
Everything you need to know about the Federal Reserve
The initial reaction for the US Dollar Index was to pullback on the data release. Within the first 15 minutes after, the DXY pulled back from 105.50 down to 105.30.
Source: Tradingview, Stone X
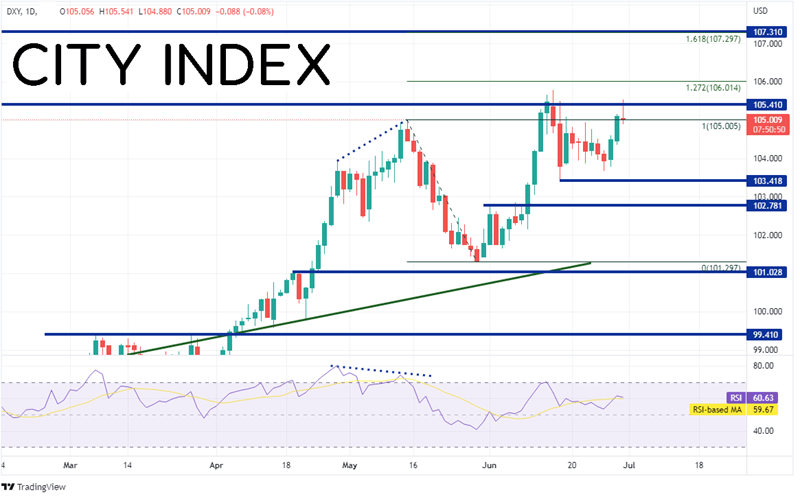
However, over the last 2 ½ days, the DXY has been on a move higher as it tries to test the highs from June 15th at 105.79, its highest level since December 2002. The high of the move today as of the time of this writing is 105.54. Resistance above is at the 127.2% Fibonacci extension from the highs of May 13th to the lows of May 30th near 106.01. Above there, price can move to a confluence of resistance at the 161.8% Fibonacci extension from the same timeframe and the highs from December 2002 near 107.30. Support below is at the low of June 16th at 103.42, then horizontal support at 102.78.
Source: Tradingview, Stone X
Trade the DXY now: Login or Open a new account!
• Open an account in the UK
• Open an account in Australia
• Open an account in Singapore
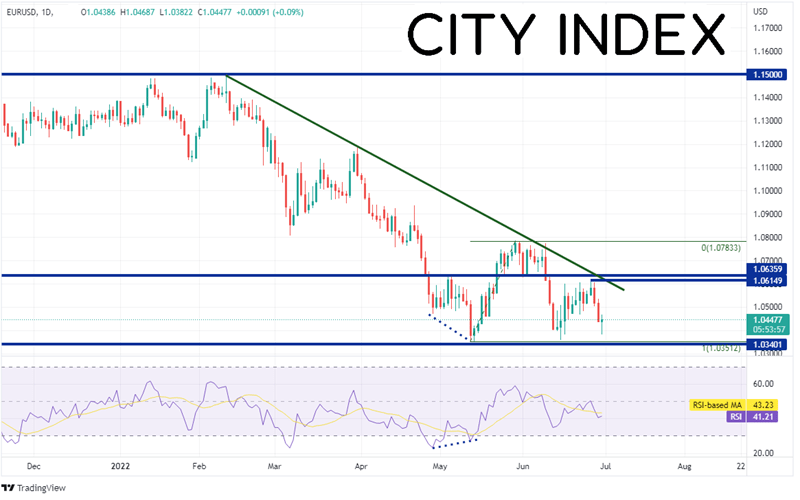
The Euro makes of 57% of the US Dollar Index. Therefore, it’s not a surprise that when the DXY moves in one direction, EUR/USD moves in the opposite direction. EUR/USD has been moving lower over the last 3 days as the US Dollar Index was moving higher. The pair is trying to test the lows from May 13th at 1.0349, just 9 pips from its lowest level since December 2002. If the pair does continue lower, support is at the 127.2% and 161.8% Fibonacci extensions from the lows of May 13th to the highs of May 30th at 1.0234 and 1.0084, respectively. However, if EUR/USD moves higher, first resistance is at the highs from June 27th and the downward sloping trendline (green) near 1.0615. Just above there is long-term horizontal resistance at 1.0536, then the highs from May 30th at 1.0784.
Source: Tradingview, Stone X
Trade EUR/USD now: Login or Open a new account!
• Open an account in the UK
• Open an account in Australia
• Open an account in Singapore
US Core PCE was released today and it was softer than expected. Will it matter to the Fed? It probably won’t matter in isolation, as the Fed is now looking at a number of inflation data points to help determine the next direction for inflation in the US.
Learn more about forex trading opportunities.
Latest market news
Today 08:15 AM
Latest Trade Ideas articles

Today 08:15 AM

Today 05:45 AM