


April 29, 2022 3:24 PM
The US released what is considered to be the Fed’s favorite measure of inflation on Friday, the Core PCE Price Index. The March print was 5.2% YoY vs 5.3% YoY expected and 5.3% YoY in February. The headline PCE Price Index rose by 6.6% YoY vs 6.8% YoY expected and 6.3% YoY in February. This was the largest increase in the headline print ever. Although the core print may have leveled off in March, its still arguably high, considered that the Fed targets 2% inflation. However, what may be more worrisome for the Fed when they meet next week is the strength of the Employment Cost Index (ECI), or compensation costs for civilian workers. The Q1 reading was 1.4% QoQ vs 1.1% QoQ expected and 1% QoQ in Q4 2021. This was the highest ECI reading since 1995. So, although the Fed may have found some breathing room regarding rising prices, it still has to consider the effects of rising wages.
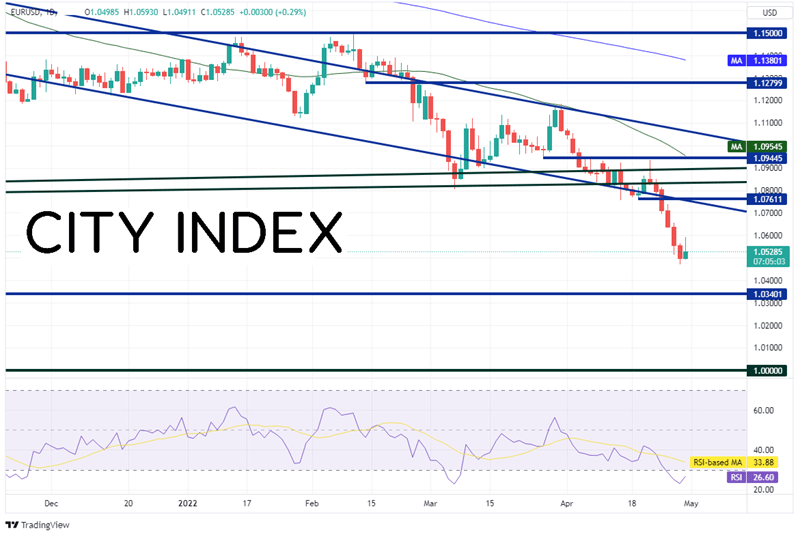
EUR/USD had been moving lower since May 2021 in an orderly channel. However, on April 21st, the price action for the pair formed a shooting star candlestick formation. This is a bearish one-day candlestick formation in which price opens and moves higher, only to be met by sellers later in the day which sends price lower to close near the open. Over the course of the next 5 days, EUR/USD moved from 1.0770 down to a near-term low of 1.0470. The next support level isn’t until 1.0340, which is the low from January 2017. Below there, price can fall all the way to the psychological round number support level of 1.000. However, notice the RSI is in oversold territory and has turned up, an indication that the pair may be ready for a bounce.
Source: Tradingview, Stone X
Trade EUR/USD now: Login or Open a new account!
• Open an account in the UK
• Open an account in Australia
• Open an account in Singapore
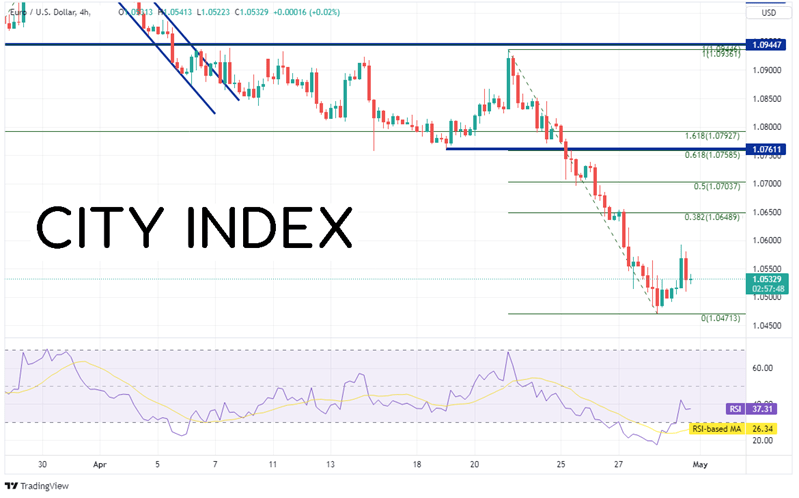
On a 240-minute timeframe, EUR/USD has bounced slightly as traders may be taking profits ahead of the long May Day holiday in much of the world. However, first resistance isn’t until the 38.2% Fibonacci retracement level from the highs of April 22nd to the low of April 28th at 1.0649, and then the 50% retracement level at 1.0704. Above there is a confluence of resistance at the April 19th lows and the 61.8% Fibonacci retracement from the same time period neat 1.0760.
Source: Tradingview, Stone X
Although the Core PCE may have eased slightly, it is still a cause for concern for the Fed at such an elevated level. In addition, the Fed now must consider the effects of a higher Employment Cost Price Index. The Fed meets next week and is set to raise 50bps However, today’s data does give them just a little more information to think about!
Learn more about forex trading opportunities.
Latest market news
Today 01:15 PM
Today 07:49 AM
Today 04:24 AM
Latest Trade Ideas articles

Today 07:49 AM
Today 04:24 AM