


Asian Futures:
- Australia's ASX 200 futures are down 0 points (0%), the cash market is currently estimated to open at 7,341.40
- Japan's Nikkei 225 futures are down -410 points (-1.46%), the cash market is currently estimated to open at 27,708.03
- Hong Kong's Hang Seng futures are up 108 points (0.4%), the cash market is currently estimated to open at 27,261.13
UK and Europe:
- UK's FTSE 100 index fell -120.36 points (-1.68%) to close at 7,030.66
- Europe's Euro STOXX 50 index fell -86.87 points (-2.13%) to close at 3,991.66
- Germany's DAX index fell -272.07 points (-1.73%) to close at 15,420.64
- France's CAC 40 index fell -130.99 points (-2.01%) to close at 6,396.73
Thursday US Close:
- The Dow Jones Industrial fell -259.86 points (-0.75%) to close at 34,421.93
- The S&P 500 index fell -37.31 points (-0.86%) to close at 4,320.82
- The Nasdaq 100 index fell -88.399 points (-0.6%) to close at 14,722.14
Learn how to trade indices
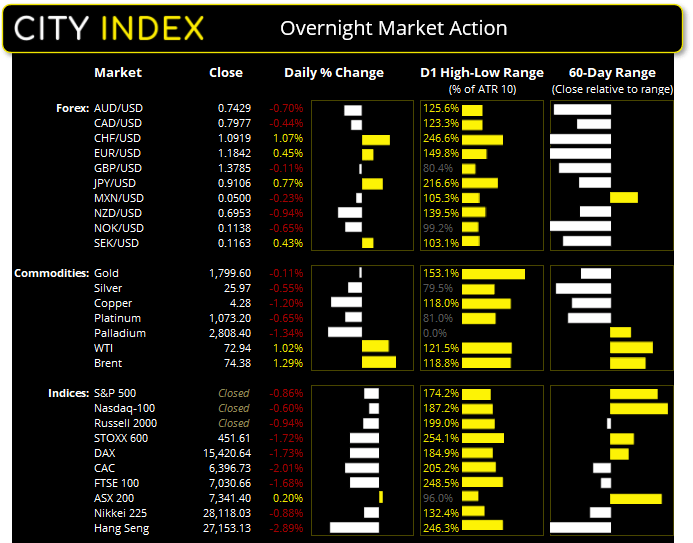
Indices all in the red, employment in question
The pace of the economic recovery in the US was back under scrutiny, with data coming in softer than expected. US initial jobless claims rose unexpectedly and job opening fell to add further doubt over the economic recovery. Earlier this week the ISM services PMI report also showed that the employment component contracted for the first time this year, falling from 55.3 to 49.3. And the CESI (City Economic Surprise Index) has been falling over the past few weeks which means data is no long surprising to the upside.
As markets have been getting revved up on the potential for the Fed’s tapering and bond pricing suggests that inflation may indeed be transitory. Yesterday’s employment data appears to be the straw which broke the camels back and saw positions unwound. This is turn can cause a snowball effect as portfolios are readjusted, so volatility on currency markets rose significantly.
Global equity markets were all in the red, the Nasdaq banking index fell -1.5% compared with the Nasdaq 100’s -0.6% fall. The S&P 500 was down -0.86% with all 11 sectors closing lower, led by financial and industrial stocks. Futures markets are all pointing lower so we could be in for a rocky ride in today’s session.
ASX 200 Market Internals:
ASX 200: 7341.4 (0.20%), 08 July 2021
- Information Technology (1.25%) was the strongest sector and Healthcare (-0.26%) was the weakest
- 8 out of the 11 sectors closed higher
- 5 out of the 11 sectors outperformed the index
- 92 (46.00%) stocks advanced, 94 (47.00%) stocks declined
- 8 hit a new 52-week high, 0 hit a new 52-week low
- 72.5% of stocks closed above their 200-day average
- 61.5% of stocks closed above their 50-day average
- 48.5% of stocks closed above their 20-day average
Outperformers:
- + 13.7% - Zip Co Ltd (Z1P.AX)
- + 9.47% - Nuix Ltd (NXL.AX)
- + 6.56% - Nearmap Ltd (NEA.AX)
Underperformers:
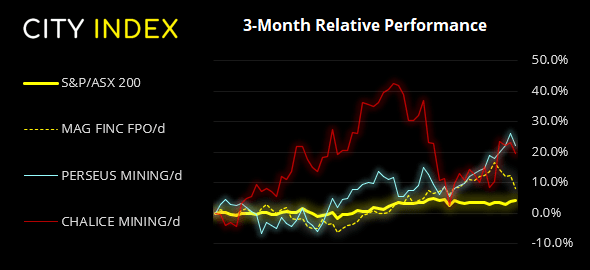
- -3.87% - Magellan Financial Group Ltd (MFG.AX)
- -3.11% - Perseus Mining Ltd (PRU.AX)
- -2.77% - Chalice Mining Ltd (CHN.AX)
Forex: CHF and JPY soar during turbulent trade
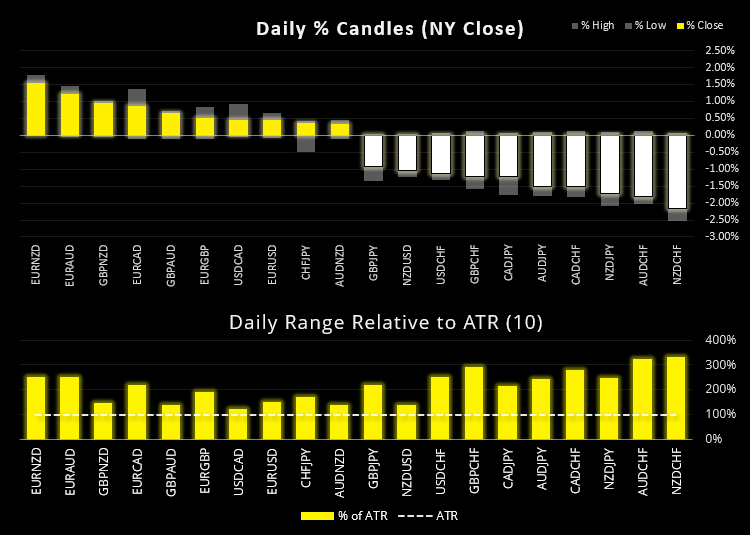
Safe haven currencies CHF and JPY were the clear leaders overnight, with some of the currency pairs rising between 2-3 times their usual daily ranges. As is usually the case during times of turbulence, commodity currencies were offloaded to see NZD, AUD and CAD as the weakest currencies.
NZD/CHF fell over -2% during its most bearish (and volatile) session since March 2020 and AUD/CHF fell around -2% to a 6-month low. The Swiss franc was the favoured safe haven as CHF/JPY actually rose 0.3% despite the ye also taking in safety flows.
The US dollar index (DXY) fell -0.3% to a two-day low after finding resistance at the 92.78/83 gap on the daily chart. We outlined the potential for the dollar to retrace yesterday but the volatility was much higher than anticipated. Perhaps a base can form at trend support projected from the June 1st low, whilst a break beneath it brings 92.00 into focus (near the 200-day eMA).
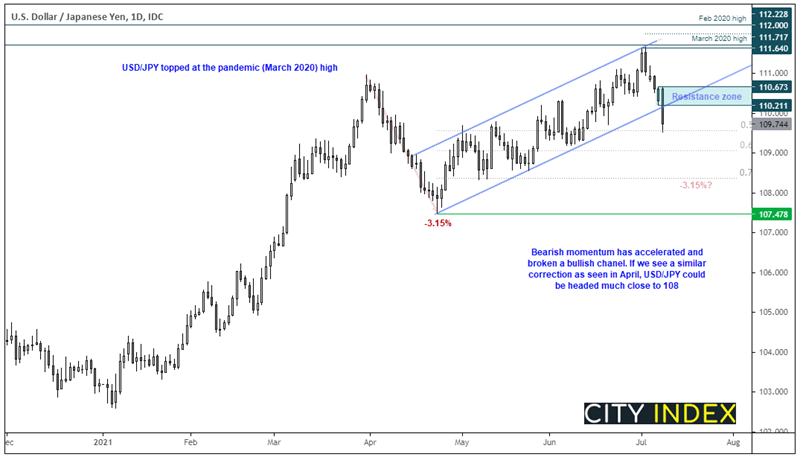
Incidentally, USD/JPY topped at the March 2020 high (or the pandemic high) and bearish momentum has accelerated to see prices invalidate the bullish channel. To provide perspective, USD/JPY retraced -3.15% in the first three weeks of April, so if we are to see a retracement of similar size then price could fall to around 108.11.
USD/JPY found support at the 50% retracement level, although traders across Asia are yet to react. However, be warned that volatility can cut both ways during times if turbulence. Therefore, there are two basic approaches to consider on USD/JPY. Bears can either seek continuation patterns on intraday timeframes (pennants, triangles, flags etc) and step aside if bullish momentum returns. Or wait to see if a retracement find resistance, perhaps somewhere around the broken trendline or the 110.21 – 110.67 zone.
Learn how to trade forex
Commodities escape the wrath of volatile trade:
All things considered, commodity markets got off lightly as the baulk of volatility was seen across equity and FX markets. Gold was effectively flat although printed another bearish pinbar / Doji and closed beneath the 20, 50 and 200-day eMA’s. Copper printed a bearish inside day yet held above its 100-day eMA (we’re looking for a break beneath 4.20 to suggest another dip lower). Platinum saw an intraday break of its retracement line on the daily chart yet closed on it, so not quite the confirmation we were hoping to see to suggest it was ready to roll over once more.
Oil prices were higher as crude and gasoline inventories fell more than expected. Brent rose 1.3% and is currently around 0.6% higher in early Asian trade, so this has invalidated our near-term bearish bias.
Up Next (Times in AEST)
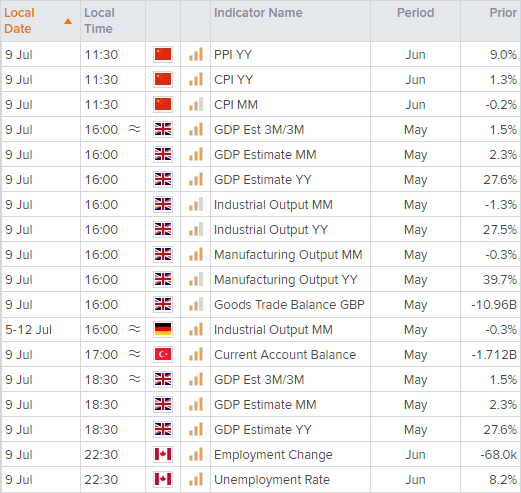
You can view all the scheduled events for today using our economic calendar, and keep up to date with the latest market news and analysis here.
How to trade with City Index
Follow these easy steps to start trading with City Index today:
- Open a City Index account, or log-in if you’re already a customer.
- Search for the market you want to trade in our award-winning platform.
- Choose your position and size, and your stop and limit levels.
- Place the trade.
Latest market news
Today 08:15 AM
Today 05:45 AM
Latest Indices articles
April 18, 2024 04:46 PM
April 17, 2024 11:00 AM
April 16, 2024 08:00 PM
April 16, 2024 04:54 PM