


August 17, 2022 8:49 PM
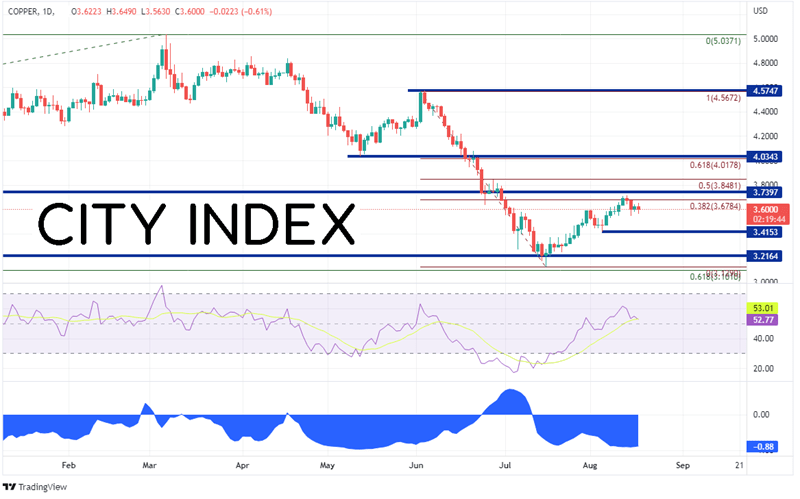
Copper is often looked at for signs of strength in the world economy. If price is moving higher, the economy is said to be strengthening. If it is turning lower, the economy is said to be weakening. Hence, the industrial commodity has earned the nickname “Dr. Copper”, as it gauges the health of the economy. Copper reached a high of 5.0372 on March 7th and quickly reversed. By July 15th the pair had fallen all the way down to the 61.8% Fibonacci retracement level from the lows of March 2020 to the highs near 3.1413. Since then, copper has bounced to a confluence of resistance at the 38.2% Fibonacci retracement level from the June 3rd highs to the July 15th lows and horizontal resistance dating to January 2021 between 3.678 and 3.740. Will the resistance hold? If so, horizontal support is at the lows from August 4th at 3.4153, then the spike lows from July 15th at 3.1290. However, if copper continues to move higher, the next resistance level is the 50% retracement level from the previously mentioned timeframe, then a confluence of resistance at the 61.8% Fibonacci retracement level and horizontal resistance between 4.0178 and 4.0343.
Source: Tradingview, Stone X
What is copper trading and how to understand copper prices?
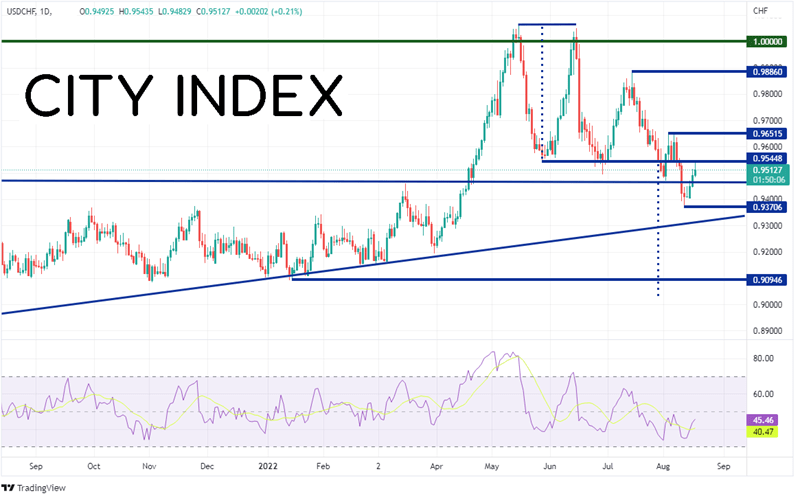
Notice the correlation coefficient between Copper and USD/CHF in the bottom panel of the chart above. The current correlation is -0.88 on the daily timeframe. A reading below -0.80 is considered a strong negative correlation. This means that on the daily timeframe, when copper moves in one direction, USD/CHF moves in the opposite direction. Traders who don’t have access to trade copper can use USD/CHF as a proxy if this negative relationship holds.
Trade Copper now: Login or Open a new account!
• Open an account in the UK
• Open an account in Australia
• Open an account in Singapore
On a daily timeframe, USD/CHF has been moving lower since making a double top near 1.0050/60 on June 15th. The neckline for the double top is today’s high at 0.9545. The next resistance level is 0.9652. If USD/CHF trades above this level, the double top will be invalidated. Above there, horizontal resistance isn’t until 0.9886 and then the psychological round number resistance at 1.0000. If the resistance holds, the first level of support is at the August 11th lows near 0.9371, then an upward sloping trendline dating to January 2021 near 0.9315. Below there, the pair can fall all the way to the lows of January 14th near 0.9095, just ahead of the price target of the double top pattern at 0.9035.
Source: Tradingview, Stone X
Trade USD/CHF now: Login or Open a new account!
• Open an account in the UK
• Open an account in Australia
• Open an account in Singapore
Copper has tended to be a leading indicator for the economy. When the industrial metal moves higher, the economy is said to be doing well. When it sells off, the economy is said to be weaker. USD/CHF has a high negative correlation with Copper. Therefore, as long as the correlation holds, traders who don’t have access to trade copper can use USD/CHF as a proxy. The next move in the direction of copper could determine the next move for USD/CHF!
Learn more about forex trading opportunities.
Latest market news
Today 05:45 AM
Yesterday 11:09 PM
Yesterday 11:01 PM
Yesterday 04:00 PM
Latest Trade Ideas articles

Today 05:45 AM
Yesterday 11:09 PM
Yesterday 04:00 PM