


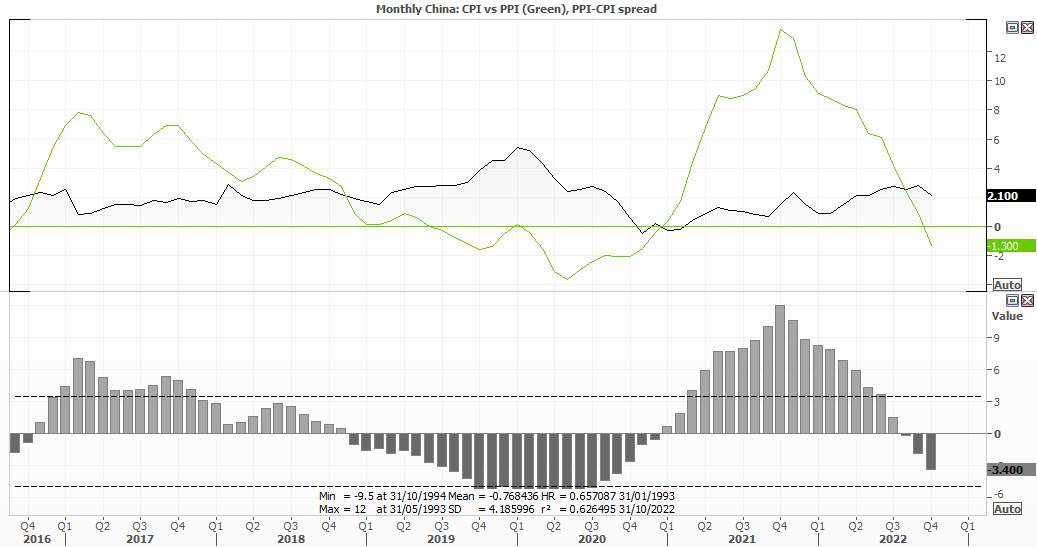
China’s factory gate did something we have long forgotten was possible – and actually contracted for the first time since December 2020. Producer prices fell -1.3% y/y in October, down from 0.9% in September and well beneath the 1.5% consensus from a Reuters poll. Consumer prices also softened, rising jut 2.1% y/y from 2.8% previously, as COVID lockdowns and a weaker yuan saw demand for goods fall.
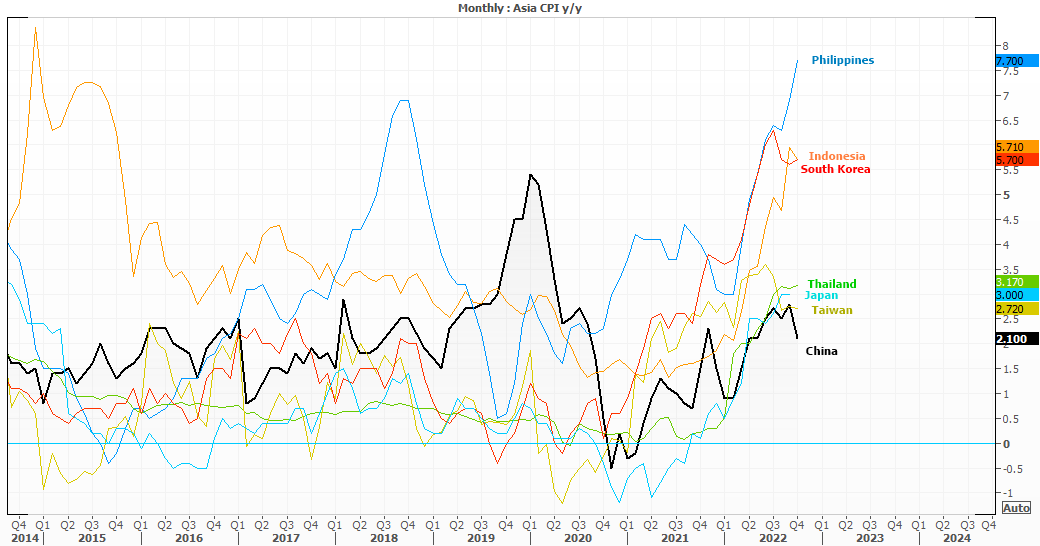
Whilst many Western economic will be enviously looking at China’s relatively low inflation numbers, there should be some comfort in the fact that lower prices for export nations can benefit all (at some point in the future). But with that said, China also has the lowest inflation level compared to many of its Asian peers, with the likes of South Korea, Indonesia and Philippines seeing annual inflation rates above 5-7%.
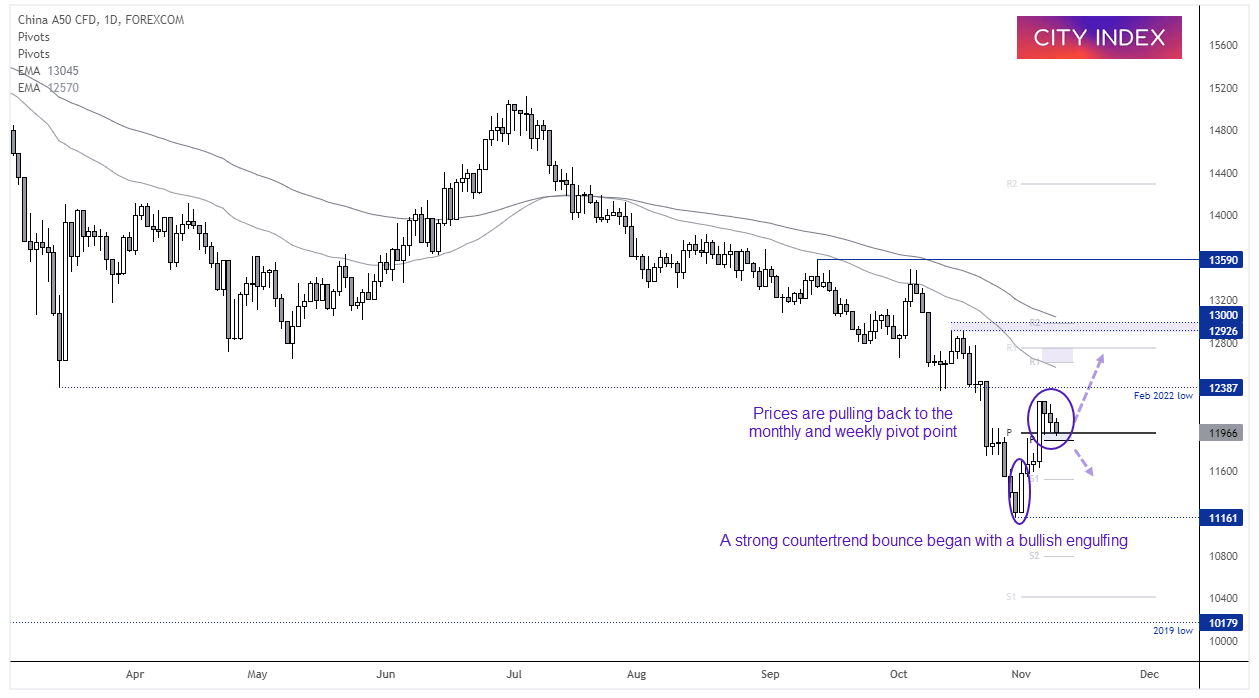
China A50 daily chart:
The A50’s downtrend has been long established, but it has produced a solid bounce from its multi-year lows and entered a countertrend move. Yet retracements rarely occur in one wave, and are usually at least three. So it is interesting to see that the market has pulled back for a third day, yet volatility is lower. And support has been found around the weekly and monthly pivot point.
We are therefore waiting for a break above today’s high to suggest the next leg higher of its 3-wave retracement is underway. An initial target is the Feb 2022 low, a break above which brings the 12,650 and 13,000 resistance zones into focus. A break of daily close beneath the weekly pivot point invalidates the near-term bullish bias.
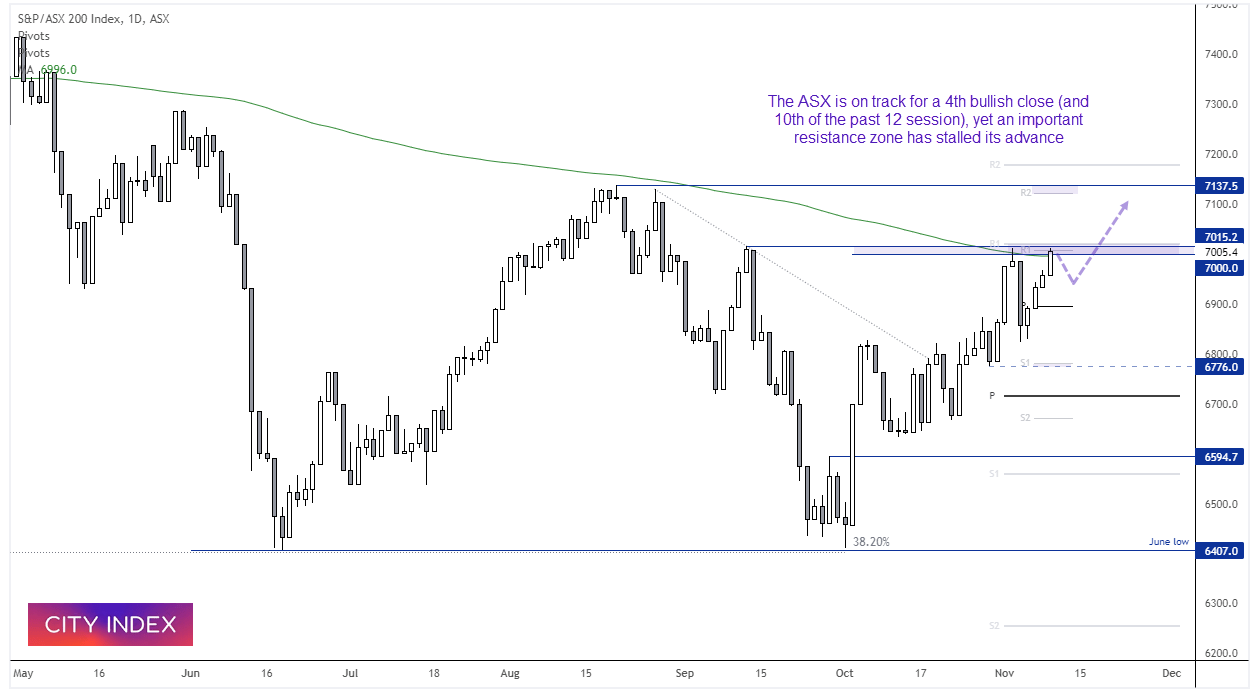
ASX 200 daily chart:
The ASX 200 is on track to close higher for a fourth consecutive day – and its 10th bullish day of the past 12. And the contrarian in me is questioning on those metrics alone as to whether the ASX is now due for a pullback.
Furthermore, its rally has stalled near an important resistance cluster which includes the 200-day MA, swing high and monthly/weekly R1 pivot point. Volumes over the prior 4 days were below average, so failure to close above resistance today risks triggering a retracement.
But as the OBV (on balance volume indicator) is trending higher with prices and broke above its own August high ahead of prices, it shows stronger underlying demand. So I suspect the ASX will go on to break above 7,000 sooner or later.
How to trade with City Index
You can easily trade with City Index by using these four easy steps:
-
Open an account, or log in if you’re already a customer
• Open an account in the UK
• Open an account in Australia
• Open an account in Singapore
- Search for the company you want to trade in our award-winning platform
- Choose your position and size, and your stop and limit levels
- Place the trade
Latest market news
Today 08:33 AM
Yesterday 11:48 PM
Yesterday 11:16 PM
Latest Trade Ideas articles


Yesterday 11:48 PM