


December 21, 2022 4:22 PM
After the US CPI released last week was softer than expected, some thought that Canada’s inflation for November would follow a similar path. However, the November CPI headline print for Canada was slightly higher than expected at 6.8% YoY vs an expectation of 6.7% YoY and a prior reading of 6.9% YoY. This was the lowest inflation reading since April and after CPI peaked at 8.1% YoY in June. The Core inflation reading was in-line with expectations at 5.8% YoY and a November reading of 5.8% YoY. The Core CPI reading has been stuck at this level three of the last four months, despite continued interest rate hikes by the Bank of Canada.
At the last Bank of Canada meeting on December 7th, the central bank hiked rates by 50bps to bring the overnight rate to 4.25%. However, the committee noted that inflation is still too high. Interestingly, the statement said that the BoC “will consider whether the policy interest rate needs to rise further”. In recent previous statements, it read that the policy rate “needs to rise further”. Will today’s CPI print give the BoC cause to increase rates further? The Bank of Canada doesn’t meet again until January 25th. Therefore, it will get one more look at inflation when Decembers CPI is released on January 17th.
Everything you need to know about the Bank of Canada
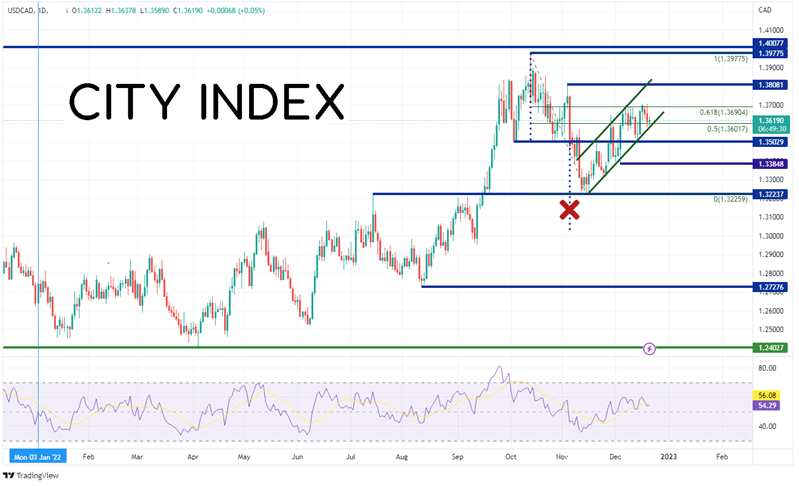
USD/CAD had been moving higher from a low of 1.2403 on April 10th to a high on October 13th at 1.3978. Since then, the pair pulled back and broke key support at 1.3503. This set up a head and shoulders pattern which targeted near 1.3025 on the downside. However, USD/CAD couldn’t break through horizontal support at 1.3226. The pair then rallied in an orderly channeled to the 61.8% Fibonacci retracement level from the highs of October 13th to the lows of November 16th near 1.3690.
Source: Tradingview, Stone X
Trade USD/CAD now: Login or Open a new account!
• Open an account in the UK
• Open an account in Australia
• Open an account in Singapore
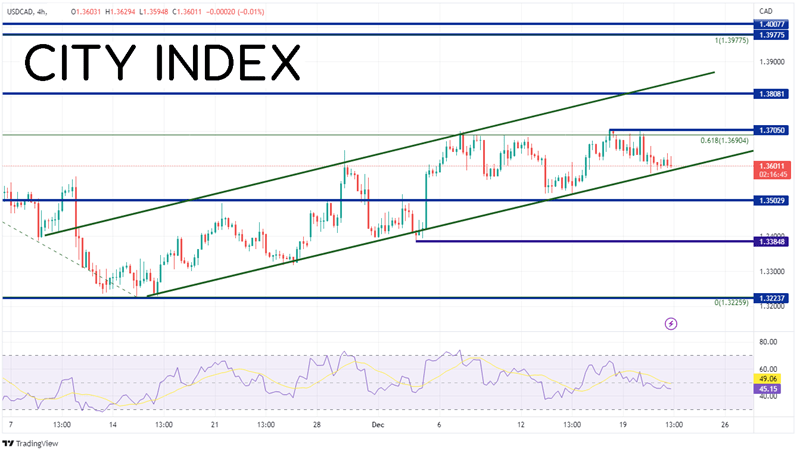
On a 240-minute timeframe, USD/CAD has been rising for the last month but has been struggling recently to push above the previously mentioned 61.8% Fibonacci retracement level. However, the pair has remained in a rising channel since mid-November. If the pair does continue to move higher, the first resistance is at the highs of December 16th at 1.3705. Above there, the pair can move to the highs from November 3rd at 1.3808 and then the top trendline of the channel near 1.3840. USD/CAD is currently trading near the bottom trendline of channel. If the pair breaks lower, the first support level is at the neckline of the previously mentioned head and shoulders pattern near 1.3502. Below there, support is at the lows of December 4th at 1.3390, then the lows of November 16th near 1.3690.
Source: Tradingview, Stone X
The November CPI reading was slightly higher than expected. However, the BoC will have one more look at the inflation reading for December before its January meeting. Is the 6.8% YoY reading high enough for the committee to continue to raise rates? We’ll know more after the January 17th CPI release!
Learn more about forex trading opportunities.
Latest market news
Today 08:15 AM
Today 05:45 AM
Latest Trade Ideas articles

Today 08:15 AM

Today 05:45 AM