
January 17, 2023 8:50 PM
Expectations are for the Bank of Canada to hike 25bps when the central bank meets next week to discuss monetary policy. The December CPI showed inflation at 6.3% YoY, much higher than the BoC’s 2% target. However, the YoY print dropped from 6.8% YoY in November vs an expectation of 6.4% YoY. In addition, as with the US CPI, it’s the MoM rate that people are talking about. The December CPI MoM dropped -0.6% vs a prior reading of 0.1% and an expectation of -0.5%. This was the largest drop in the month-over-month series since April 2020. So, although inflation is dropping, it still may be too high for the Bank of Canada. Also recall that Canada’s December Employment Change was very strong, with the economy adding 104,000 jobs vs an expectation of only 8,000 jobs. Even better, over 84,500 of those jobs were full-time. Although inflation is moving in the right direction for the BoC, the jobs data may give it the confidence to hike rates one more time.
Everything you need to know about the Bank of Canada
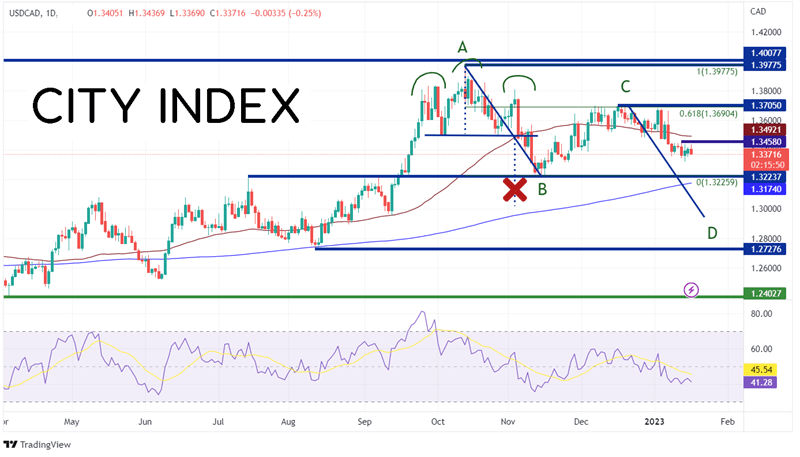
USD/CAD had slowly been moving higher throughout 2022 until the pair broke above resistance at 1.3223 on September 15th. USD/CAD then quickly moved higher to the 2022 highs on October 13th at 1.3976. The pair then formed a head and shoulders pattern but failed to break through support on its way to target. USD/CAD bounced to the 61.8% Fibonacci retracement level from the October 13th, 2022 high to the previous support level, at 1.3690. This set up the current AB=CD pattern. The target for the pattern is near 1.2950.
Source: Tradingview, Stone X
Trade USD/CAD now: Login or Open a new account!
• Open an account in the UK
• Open an account in Australia
• Open an account in Singapore
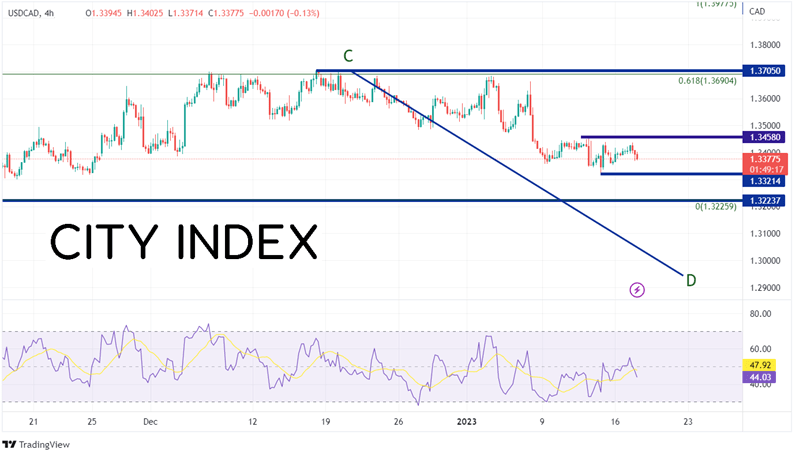
On a 240-minute timeframe, first support is at the lows of January 13th at 1.3321. Below there, price can move to the long-term support line at 1.3224, the 200 Day Moving Average at 1.3174 (see daily), and then the psychological round number support level at 1.3000, ahead of the target. However, if USD/CAD bounces, first resistance is at the highs of January 12th at 1.3458. Above there, price can move to the 50 Day Moving Average at 1.3492 (see daily), then the highs from December 16th, 2022, at 1.3705.
Source: Tradingview, Stone X
Canadian CPI for December was better than expected, and much lower than that of November. In addition, the MoM print was the largest negative print since May 2020. Will this be enough for the BoC to hold on rates when it meets next week? With a headline print still at a very high reading of 6.3% YoY and strong jobs data, the BoC is still expected to hike 25bps.
Learn more about forex trading opportunities.
Latest market news
Yesterday 08:33 AM