


October 25, 2022 8:03 PM
In the span of 1 hour, markets began to try and put together the pieces of the economic puzzle of the US economy. The S&P / Case-Schiller Home Price Index for August was released at 9:00am ET and showed that prices dropped 1.6% MoM vs an expectation of only a 0.7% MoM drop. All 20 cities in the index reported lower price gains (YoY) in August. One hour later, Central Bank Consumer Confidence for October was released and showed that confidence dropped to 102.5 vs an expectation of 106.5 and a September reading of 107.8! At the same time, the next of the regional Fed Manufacturing Indexes was released. This time it was Richmond. By itself it usually doesn’t mean much. However, with the Philadelphia Fed Manufacturing Index weaker than expected last week, traders are wondering if a trend may be setting in.
With lower housing prices, lower consumer confidence, and lower manufacturing data, markets seem to be warming up to the idea that was floated by the WSJ last week that the Fed will begin discussing slowing the pace of rate hikes at the December meeting. The markets love the idea of an unhurried pace of increases, and therefore, stocks went bid and the US Dollar sold off throughout the morning.
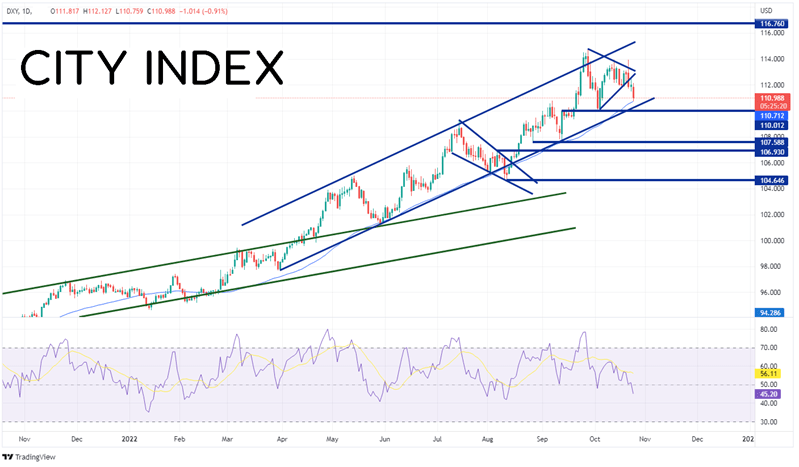
The US Dollar Index has been moving in an aggressive upward sloping channel since early April when price was below 100. On September 26th, the index posted a false breakout above the channel and reached a high of 114.78 before pulling back into the channel. Since then, price consolidated in a symmetrical triangle within the channel. However, on October 21st, when the BOJ was suspected of intervening in the fx markets by selling US Dollars and buying Yen, the DXY posted a false breakout above the triangle and then sold off, only to close below the apex of the triangle. On Monday and Tuesday this week, the US Dollar Index continued lower and is currently testing the 200 Day Moving Average near 110.71.
Source: Tradingview, Stone X
Trade the DXY now: Login or Open a new account!
• Open an account in the UK
• Open an account in Australia
• Open an account in Singapore
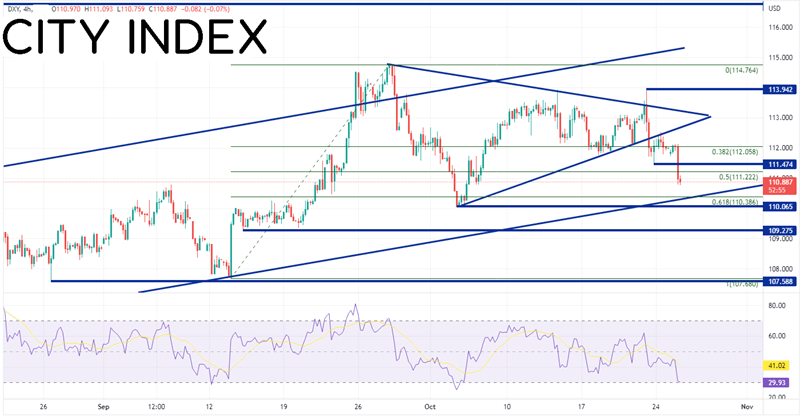
On a 240-minute timeframe, as mentioned, the DXY is testing the 200 Day Moving Average (see daily) and has broken the 50% Fibonacci retracement level from the lows of September 13th to the highs of September 28th at 111.22. If price continues to move lower, the first support level is at the confluence at the bottom trendline of the long-term channel and the 61.8% Fibonacci retracement from the previously mentioned timeframe near 110.39, then the October 4th lows at 110.07. The next support level is the lows of September 14th at 109.28. However, if the DXY holds support and moves higher, resistance is at the lows of October 24th at 111.41. Above there, the index can move to the symmetrical triangle trendlines at 112.70 and 113.25 and then the highs of October 21st at 113.94.
Source: Tradingview, Stone X
Will the DXY continue its most recent selloff and continue to move lower? It may depend on the upcoming economic data releases from the US this week, which includes a slew of housing data and Core PCE. However, next week is the FOMC meeting. Price may remain subdued until after the statement is released and the press conference which follows.
Learn more about forex trading opportunities.
Latest market news
Yesterday 03:30 PM
Yesterday 01:23 PM
Yesterday 11:00 AM
Yesterday 08:15 AM
Latest Trade Ideas articles
Yesterday 11:00 AM
Yesterday 08:15 AM
Yesterday 05:45 AM