


August 15, 2022 3:24 AM
CSL Limited (CSL) is Australia's largest drugmaker, one of the world's largest biotech companies, a leader in flu treatments and plasma protein therapies, and a leading provider of in-licensed vaccines.
CSL is the third largest company in the ASX200 with an index weighting of ~6.9% and reports its Full Year numbers this Wednesday the 17th of August.
COVID-19 provided a headwind for CSL's supply chains and the collection of plasma, an essential raw material used to produce many of CSL's therapies, which account for almost half of CSL's sales. In the first 1H 2022, CSL reported a 5% fall in Net Profit After Tax (NPAT) to $1.76bn.
In December 2021, CSL announced it would acquire 100% of Vifor Pharma Ltd, a global speciality pharmaceutical company with leadership in renal disease and iron deficiency. After a delay to do with antitrust issues, the US$11.7bn deal received regulatory clearance and was recently completed.
While the deal will have no bearing on the company’s earnings for 2022 it will provide the company with a bigger footprint within the industry, a more diversified earnings stream and boost CSL’s earnings in 2023.
Along with strong demand for plasma products and a drop in the fees paid to plasma donors (boosted payment incentives no longer needed to attract donors as they were during COVID-19), the company ends this financial year in a strong position.
CSL’s earnings are heavily screwed to the first half of the year. Full Year NPAT is expected to be in the range of $2.15bn-$2.25bn.
CSL Daily Chart
The decline from the $342.75 high of February 2020 to the $240.10 low in February 2022 completed a correction and the CSL share price is eyeing trend channel resistance near $310/12 where profit taking/selling is likely to emerge.
Should the CSL share price break above the resistance at $310/12 and then above resistance at $320/21 it would likely open up a retest and break of the $342.75 high.
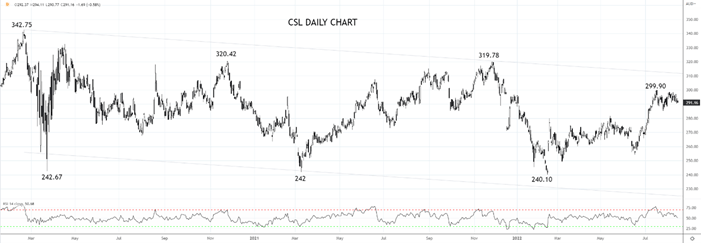
Source Tradingview. The figures stated are as of August 15, 2022. Past performance is not a reliable indicator of future performance. This report does not contain and is not to be taken as containing any financial product advice or financial product recommendation
How to trade with City Index
You can trade with City Index by following these four easy steps:
-
Open an account, or log in if you’re already a customer
• Open an account in the UK
• Open an account in Australia
• Open an account in Singapore
- Search for the company you want to trade in our award-winning platform
- Choose your position and size, and your stop and limit levels
- Place the trade
Latest market news
Latest Australia 200 articles
February 15, 2024 11:33 PM
February 15, 2024 01:42 AM
February 14, 2024 05:39 AM