


September 5, 2019 5:50 PM
AUD/USD Continues its Impressive Rally
AUD/USD continued its move off the recent lows to increase its gains to over 1.5% over the last three days moving back towards the center of the downward sloping channel. The commodity currency began its rally after Australia released its Q3 GDP, which came in as expected. In addition to the economic data, the ongoing US-China trade war tensions have been easing as potential meetings were discussed for mid-September between the two rival countries.
The pair traded right into the 38.2% retracement of the July 19th highs to the September 13th lows at 0.6356. There is also horizontal resistance here as it is close to the daily candle low from June 18th. The next area of resistance is the 50% retracement of the previously mentioned move and horizontal resistance, which comes in around 0.6910/0.6930. Above that, resistance comes in at the top of the channel near 0.7000.
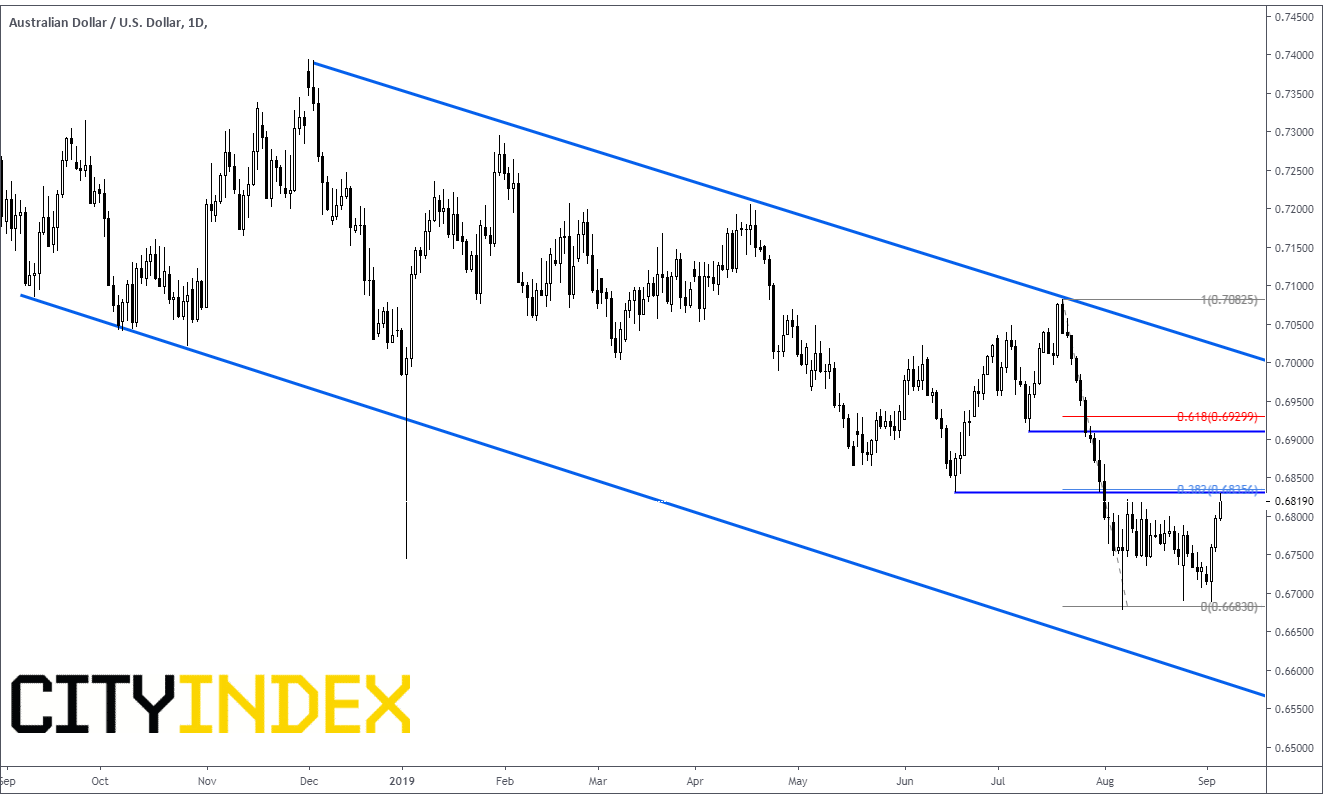
Source: Tradingview.com, City Index
On a four-hour chart, the RSI is overbought and beginning to turn down. This typically indicates that the move may be a bit overdone and a pullback is near. On the same shorter-term timeframe, AUD/USD is also trading back towards the top of a trading range dating back to August 1st. There isn’t much support below until 0.6677.
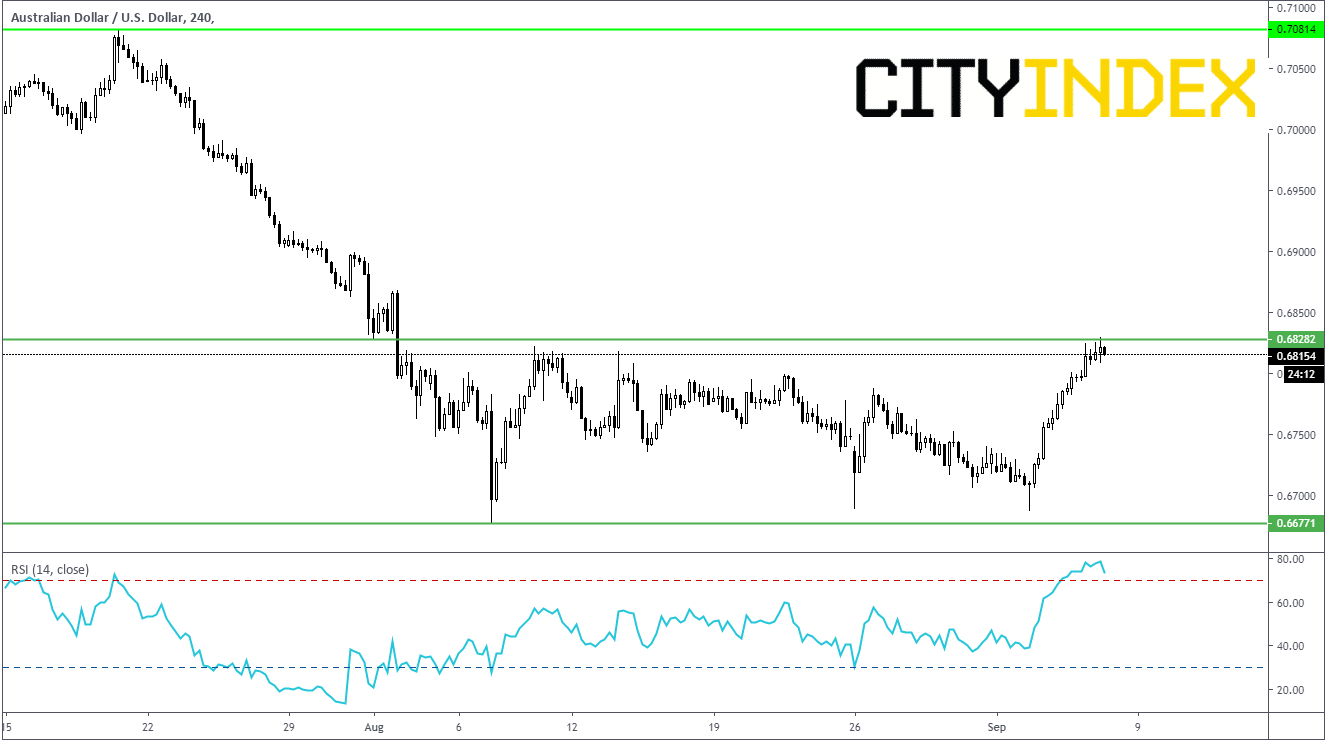
Source: Tradingview.com, City Index
Strong resistance above current levels of 0.6813 makes this a prime candidate for at least a short-term pullback. Stops may be placed about the horizonal trendline and 38.2% retracement level at 0.6828. A target possible could be the previous lows of 0.6677.
Latest market news
Yesterday 01:23 PM
Yesterday 06:01 AM
April 18, 2024 11:27 PM
April 18, 2024 04:46 PM
Latest Dollar articles
April 18, 2024 06:20 AM
February 16, 2024 11:30 AM
February 7, 2024 03:30 PM
February 2, 2024 02:00 PM