


August 15, 2022 8:32 PM
Earlier, China had a July data dump and released a plethora of economic data….and it was bad:
- Industrial Production fell to 3.8% vs 4.6% expected and 3.9% in June
- Retail Sales fell to 2.7% vs 5% expected and 3.1% in June
- Fixed Asset Investment (YTD) fell to 5.7% vs 6.2% expected and 6.1% in June
- The House Price Index was -0.9% vs -0.8% expected and -0.5% in June
As a result of the poor data, the PBOC surprised markets and by cutting the one-year lending facility by 10bps to 2.75%, catching most of the market off guard. The bad data sent commodities lower, such as Gold and Oil, and sent the US Dollar higher. It was almost a perfect storm for AUD/USD to sell off. On Tuesday, the RBA will release the Minutes from its Interest Rate Decision meeting on August 2nd, however, they are likely to be stale (as should the US FOMC Minutes on Wednesday). At that meeting, the RBA hiked rates by 50bps to 1.85% and said that it will continue to hike, however it is not on a preset path. The committee will be guided by the incoming data. Will there be a surprise in the Minutes that can push the AUD/USD higher?
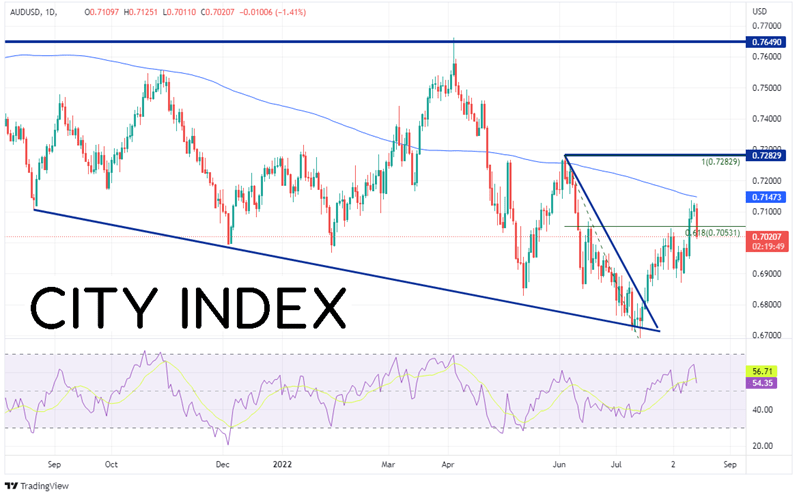
On a daily timeframe, AUD/USD had been moving lower in a descending wedge since June 3rd when price reached 0.7283 and was rejected at the 200 Day Moving Average. The pair traded down and tested a long-term downward sloping trendline dating to August 20th, 2021 and held. On July 18th, the pair broke above the top trendline of the wedge and moved above the 61.8% Fibonacci retracement level from the highs of June 3rd to the lows of July 14th, however was rejected once again at the 200 Day Moving Average, this time near 0.7147. Today the pair fell over 100 pips to 0.7011 and may have more room to go!
Source: Tradingview, Stone X
Trade AUD/USD now: Login or Open a new account!
• Open an account in the UK
• Open an account in Australia
• Open an account in Singapore
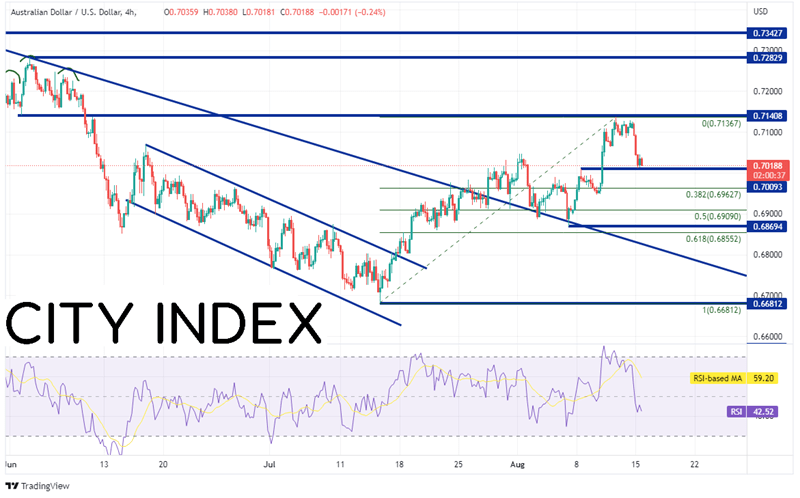
If the pair continues to move lower, first support is nearby at the highs of August 8th at 0.7009. Below there, the pair can fall to the 38.2% Fibonacci retracement level from the low of July 14th to the highs of August 11th at 0.6963 and then the 50% retracement level from that same timeframe at 0.6909. However, if AUD/USD can push higher, resistance is at the highs of August 11th and the neckline of a previous head and shoulders at 0.7141, as well as the 200 Day Moving Average at 0.7147 (see daily). Above there, price can move the horizontal resistance at the highs of June 2nd at 0.7283 and then resistance from April 18th at 0.7343.
Source: Tradingview, Stone X
With poor economic data and a rate cut from China, it was almost a perfect storm for commodity currencies to sell off, particularly, AUD/USD. Will the pair continue to move lower? It has been blocked at the 200 Day Moving Average. That level may be the key to the pair’s next direction.
Learn more about forex trading opportunities.
Latest market news
Latest Forex articles

April 17, 2024 02:40 PM
April 17, 2024 04:47 AM