
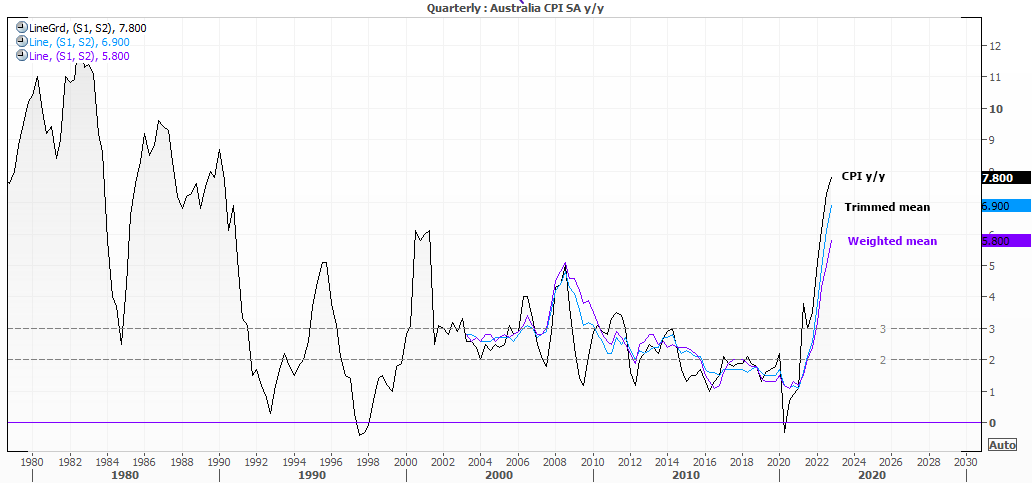


Today’s inflation report is one that matches Australia’s weather. Hot. Choose your flavour – core CPI, trimmed mean or weighted – they’re all above expectations with no obvious signs of a ‘peak’ in sight. And that has seen any hopes of an RBA pause at their February meeting evaporate, topple the ASX 200 from its arguably overbought highs and send the Aussie higher. With higher interest likely coming for Australia, China’s reopening and higher base commodity prices, the Australian dollar could be a tough currency to bet against.
Prior to the meeting there were come hopes that inflation could soothe following NAB’s business sentiment report, which cited easing pricing pressures. But with CPI at 7.8% y/y (and the new monthly annual read at 8.2% y/y) it is hard to get excited over peak inflation just yet. For comparison, US inflation peaked in July 2022 and the Fed are still hiking interest rates. And with inflation continuing to rise in Australia it is hard to see how we’ll see a peak rate at 3.6% as markets had been expecting. The OIS curve is higher across the board following the inflation report to underscore the potential of a higher terminal rate.
Market response in a nutshell
- AUD broadly higher
- ASX 200 erased most of yesterday’s gains
- GBP/AUD touched a 15-week low
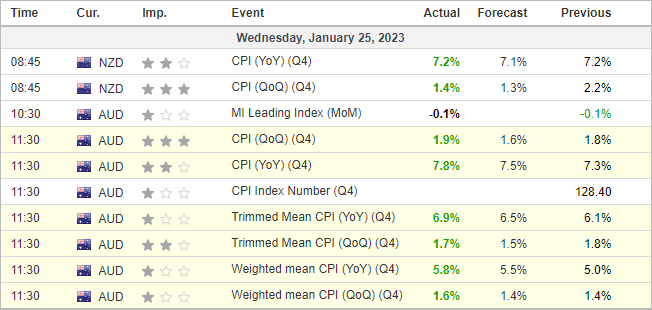
New Zealand CPI (slightly) hotter than expected
New Zealand’s Q4 inflation rose 7.2% y/y, which is slightly above 7.1% forecast yet beneath the RBNZ’s own forecast of 7.5% as of their November MPR (monetary policy report). CPI rose 1.4% q/q which is below RBNZ’s forecast of 1.7% yet above market consensus of 1.3%.
As these numbers remain high it keeps the pressure on RBNZ to tame the inflationary beast, so in all likelihood are still on track for a 50bp hike in February to take rates form 4.25% to 4.475%. As per their own projections, the RBNZ see rates peaking at 5.5% in September, although the 9-month OIS suggest a peak rate of 5.1%.
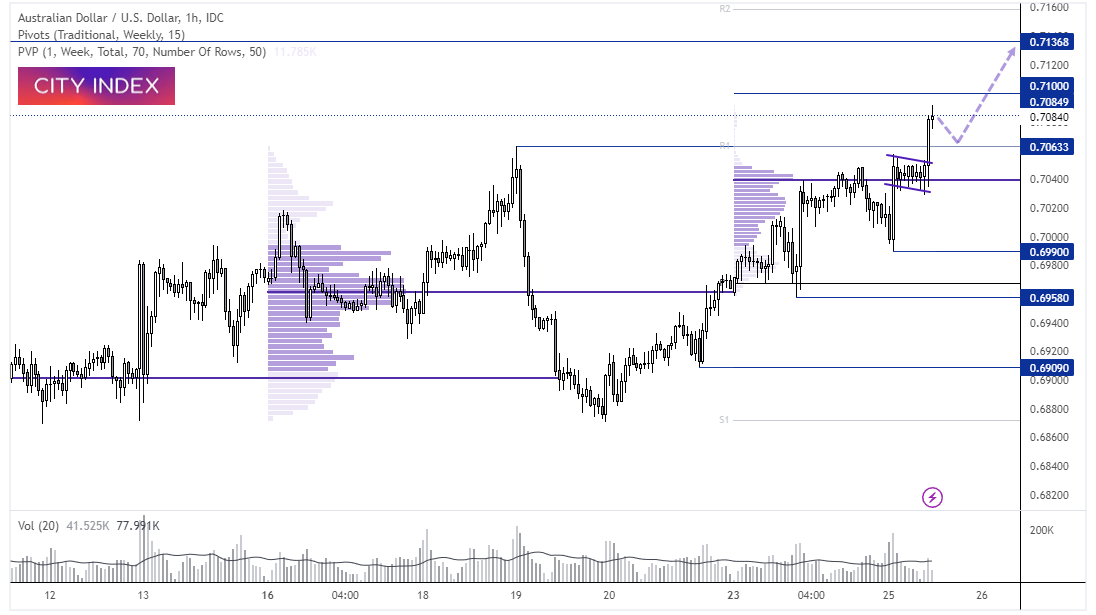
AUD/USD 1-hour chart:
The Aussie sprang higher out of its consolidation and came close to testing 0.7100 – a scenario discussed today’s client report. Yet 0.7100 is acting as resistance due to its ‘round number’ status, so perhaps we’ll see a slight pullback before its next leg higher. From here bulls could seek bullish setups above the 0.7063 high in anticipation of potential break above 0.7100.
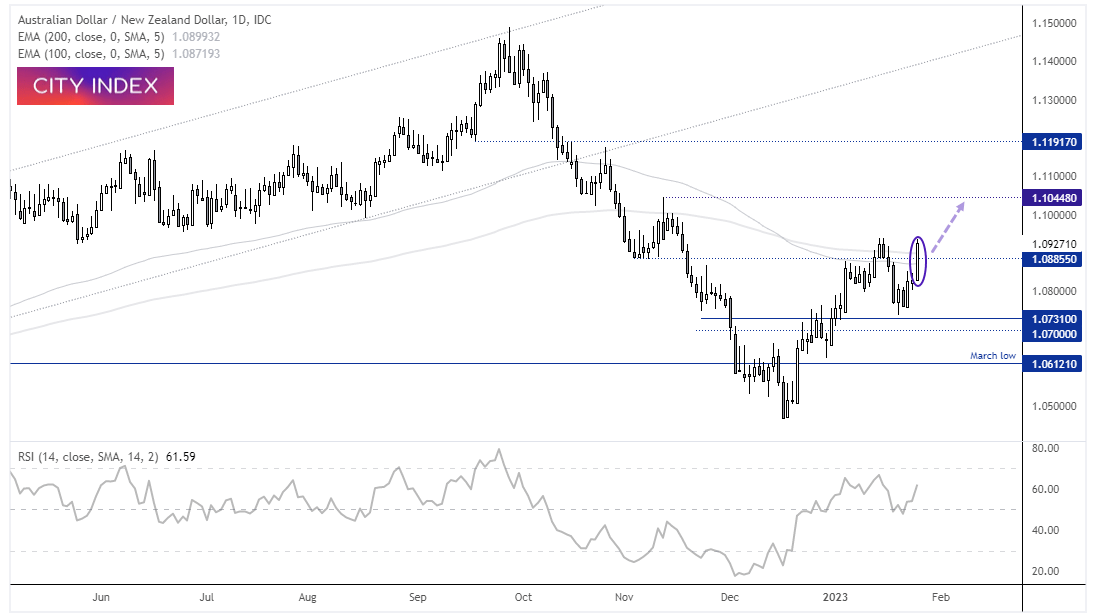
AUD/NZD daily chart:
It has been a tail of two inflation reports, and its conclusion is perfectly captured on AUD/NZD. With AU inflation rising and NZ inflation below RBNZ’s own forecasts, AUD/NZD has turned higher. At the time of writing the cross is testing last week’s highs and trying to close above the 100 and 200-day EMA’s. RSI (14) is holding above 50 to show positive momentum and confirming the rise higher on the price action. Next up could be the 1.1000 - 1.1045, a break above which brings 1.1200 into focus for bulls.
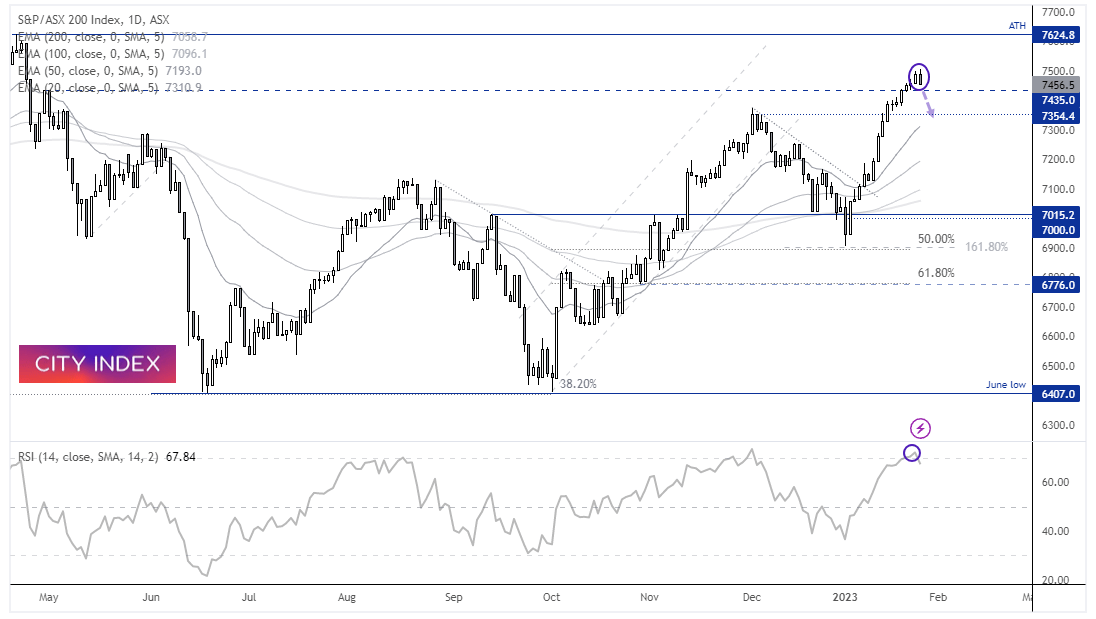
ASX 200 daily chart:
The ASX 20 has erased all of yesterday’s gains, and today’s inflation report could be the trigger which prompts an arguably needed correction. It’s had a great start to the year and has seen little in the way of a pullback. Rising trading volumes have complemented its latest rally so we do not see an overall threat to the trend, but we may see a 3-wave countertrend move. A break below 7435 would be a good first step to confirming such a pullback, with a break below 7354 suggesting a deeper correction.
Latest market news
Yesterday 01:23 PM
Yesterday 06:01 AM
April 18, 2024 11:27 PM
April 18, 2024 04:46 PM
Latest Trade Ideas articles

April 18, 2024 11:27 PM
April 18, 2024 04:46 PM