


Asian Futures:
- Australia's ASX 200 futures are down -42 points (-0.57%), the cash market is currently estimated to open at 7,395.30
- Japan's Nikkei 225 futures are down -240 points (-0.79%), the cash market is currently estimated to open at 30,430.10
- Hong Kong's Hang Seng futures are down -133 points (-0.52%), the cash market is currently estimated to open at 25,369.23
UK and Europe:
- UK's FTSE 100 index fell -34.37 points (-0.49%) to close at 7,034.06
- Europe's Euro STOXX 50 index rose 2.14 points (0.05%) to close at 4,191.67
- Germany's DAX index rose 21.57 points (0.14%) to close at 15,722.99
- France's CAC 40 index fell -23.96 points (-0.36%) to close at 6,652.97
Tuesday US Close:
- The Dow Jones Industrial fell -292.06 points (-0.84%) to close at 34,577.57
- The S&P 500 index fell -25.68 points (-0.58%) to close at 4,443.05
- The Nasdaq 100 index fell -51.6 points (-0.33%) to close at 15,382.90
Learn how to trade indices
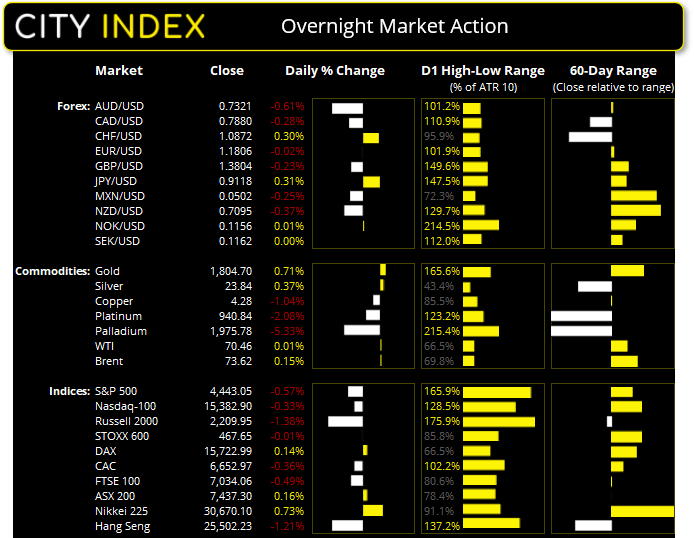
Indices: Wall Street Lower on Relatively High Inflation
The 1-day rally on Wall Street came to a halt yesterday, with large cap indices falling lower once more. Inflation data may not have been high as expected, but still high relative to pre-pandemic levels.
Core CPI ‘only’ rose 4% YoY, down from 4.3% and below 4.2% expected but clearly well above the Fed’s % average target. CPI including food and energy rose 5.3%, down from 5.4%.
Industrial stocks led the declines with the Dow Jones (DJI) falling -0.84% and printing a bearish engulfing candle. Technically the Dow remains interesting for bears as it closed below trend support on Thursday and yesterday’s high respected the 50-day eMA as resistance.
The S&P 500 fell -0.57% and closed just below trend support, after failing to break above Monday’s Doji which was required to confirm it as a bullish reversal candle.
The ASX 200 keeps coming back to test the 7430 – 7430 resistance zone, having spent three days gradually retracing against the Thursday’s sell-off. Due to the broken trendline on strong bearish momentum we favour another leg lower, but this really could break either way over the near-term. A break below 7389 confirms yesterday’s candle as a hanging man reversal (bearish reversal candle) whilst a break above yesterday’s high confirms it to be a bullish hammer.
The Nikkei 225 probed the February high to reach its most bullish level in 31 years yesterday. It wouldn’t be unreasonable to expect some profit taking at these levels but, given expectations of more stimulus have pushed prices here, we make no promises that prices will roll over as they could instead march defiantly higher.
ASX 200 Market Internals:
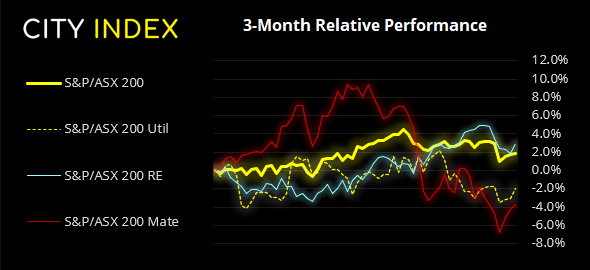
ASX 200: 7437.3 (0.16%), 14 September 2021
- Utilities (1.13%) was the strongest sector and Industrials (-1.06%) was the weakest
- 5 out of the 11 sectors closed higher
- 4 out of the 11 sectors closed lower
- 115 (57.50%) stocks advanced, 81 (40.50%) stocks declined
- 69% of stocks closed above their 200-day average
- 58.5% of stocks closed above their 50-day average
- 44.5% of stocks closed above their 20-day average
Outperformers:
- + 7.21% - Beach Energy Ltd (BPT.AX)
- + 6.55% - Chalice Mining Ltd (CHN.AX)
- + 6.23% - Woodside Petroleum Ltd (WPL.AX)
Underperformers:
- -8.32% - Brambles Ltd (BXB.AX)
- -4.99% - Uniti Group Ltd (UWL.AX)
- -3.77% - Monadelphous Group Ltd (MND.AX)
Forex: RBA shakes off (already weak) hike hopes
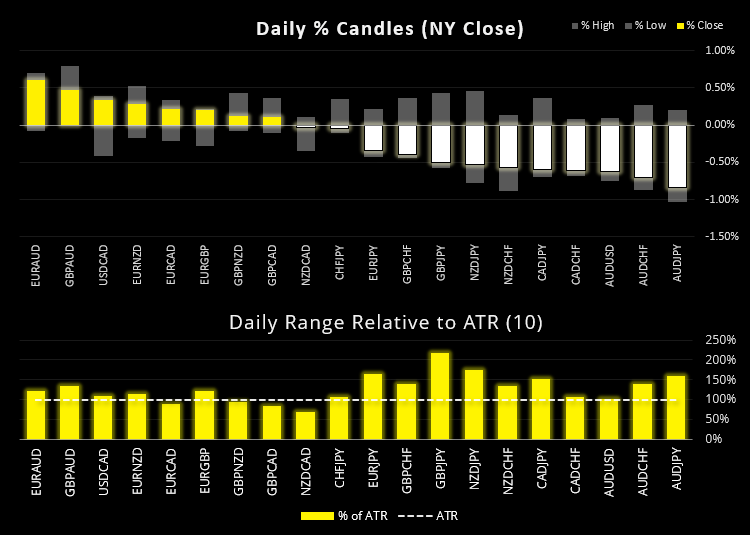
EUR/USD remains anchored around the 1.18 level after seeing a spike higher yesterday (and lower spike the day before) then simply returning to 1.18. It’s not the price action we favour so prefer to step aside from the euro (and therefore, DXY) until its next perceived directional move becomes clearer.
Traders appear a little underwhelmed at RBA Governor Lowe’s talk yesterday. Citing markets pricing in a hike in late 2022 / early 2023, he does not understand market positioning given expectations of contracting growth in Q3, and sanguine wage growth and inflation in Australia not in line with global trends. AUD/USD printed a bearish engulfing candle yesterday and closed firmly beneath its 20-day eMA and 38.2% Fibonacci ratio. AUD/NZD fell to 1.30 yesterday, its lowest levels since April 2020 as RBA continue to out-dove a relatively hawkish RBNZ.
NZD/JPY has failed to close above 78.50 on several occasions and met resistance at 78.65 over the past 2-weeks. So yesterday’s bearish engulfing candle at this high suggests downside momentum could accelerate, especially if general appetite for risk sours.
New Zealand release current account data at 08:45 AEST, Japan’s machinery orders are scheduled for 09:50 and South Korean growth will be revised at 34.90, which could all weigh on NZD if they undershoot expectations by a wide-enough margin.
Learn how to trade forex
Commodities: Gold rebounds from 1780
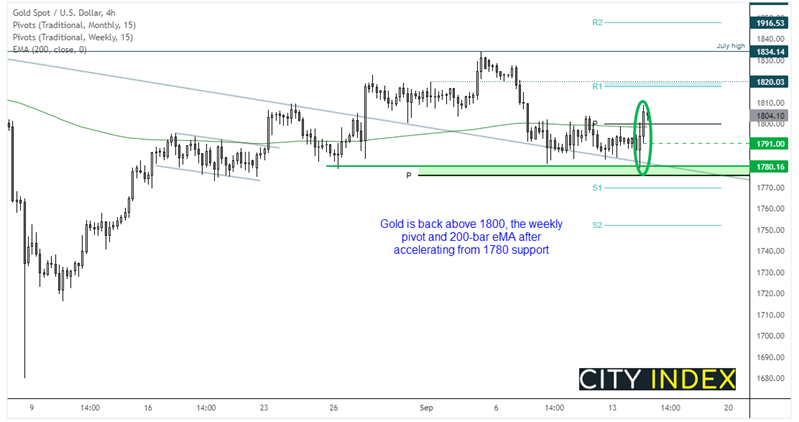
Think what you will about yesterday’s inflation data, but gold bugs clearly liked it as it leans towards a diminished argument for the Fed to taper sooner than later. 1780 has proven to be a reliable support level since the 26th August and, noise aside, prices have mostly respected the broken trendline and momentum has now turned higher. A bullish engulfing candle on H4 marked a final low around 1780 before prices pushed higher above 1800, the 200-day eMA, weekly pivot and prior cycle high. Over the near-term our bias remains bullish above 1790.
Palladium remains in freefall with the industrial precious metal falling below 2000 for the first time since July 2020. Its found support at 1900 / weekly S2 with its next support level being the June 2020 low around 1825.
Up Next (Times in AEST)
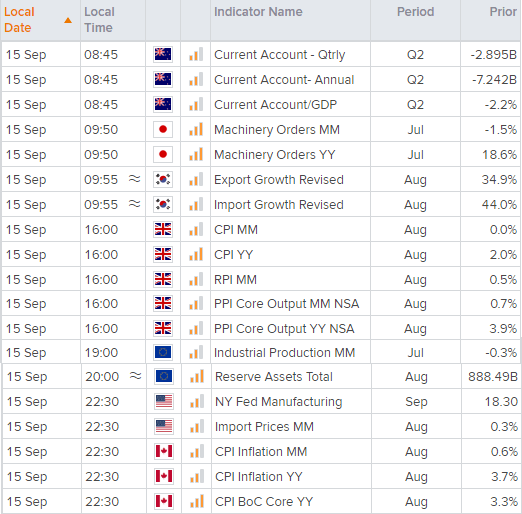
You can view all the scheduled events for today using our economic calendar, and keep up to date with the latest market news and analysis here.
How to trade with City Index
Follow these easy steps to start trading with City Index today:
- Open a City Index account, or log-in if you’re already a customer.
- Search for the market you want to trade in our award-winning platform.
- Choose your position and size, and your stop and limit levels.
- Place the trade.
Latest market news
Today 11:14 AM
Today 08:28 AM
Yesterday 03:30 PM
Latest Indices articles

Yesterday 03:30 PM
April 18, 2024 04:46 PM