


The 3-month implied volatility for 10-year treasury note has risen to its highest level since June, which suggests yields may go far higher from here.
Given the rise in inflation expectations and of course bond yields of late, we doubt the top for yields is here yet. In turn, this could cause investors to seriously reconsider if they want to be so long equities at multi-year highs. In fact, we’re already seeing signs of this (see below). Moreover, the effects of fiscal stimulus on the US economy is becoming apparent, with strong retail sales (up 5.9% in January versus 1% forecast) and higher producer prices overnight.
Given that the FOMC minutes released this morning revealed that the Fed are discussing how to lay the groundwork for higher inflation, it remains plausible the Fed may be forced to act sooner than 2023 and gently discuss tapering, as inflation may indeed overshoot their own expectations sooner than anticipated. Bond markets certainly appear to think this may happen.
Yields (and their implied volatility) weighed on equities
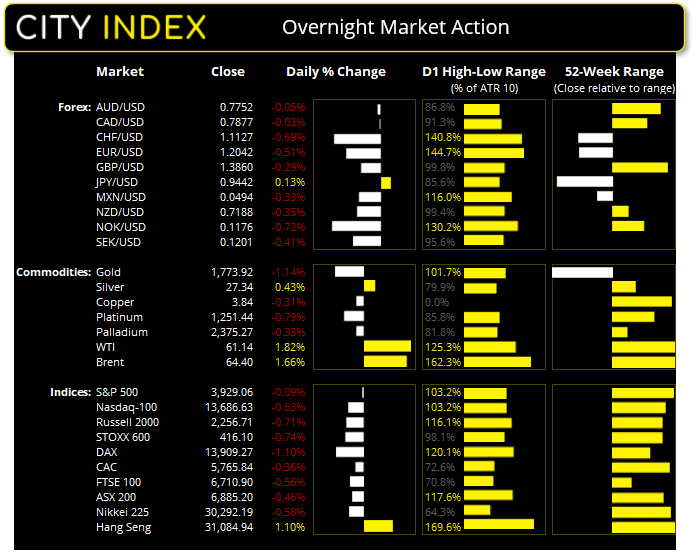
With the exception of the Nikkei 225, all major indices closed lower overnight. A spike in yields and rise in inflation are beginning to weigh on equity markets which saw indices across Europe and US turn lower. The DAX fell -1.1% to a 5-day low after stalling around its 52-week high and closed beneath its 10 and 20-day eMA. The FTSE 100 gave back -0.56% of recent gains although this is relatively minor compared with its 4.8% rally last week. The Nasdaq-100 and Russell 2000 saw intraday breaks below their 10-day eMA but closed just above them. The S&P500 was relatively unscathed as its 10-day eMA held as support, and the index essentially closed flat for the session just beneath its record high.
USD and CHF sucked Insafe-haven flows
The Japanese yen and US dollar were the strongest majors overnight as they sucked in safe-haven flows. The US dollar index (DXY) gapped higher and closed at a 6-day high and well above its 50-day eMA. USD/CHF hit a 7-day high after producing a short squeeze around 0.8830 support yesterday and appears set to break above 0.9000 and its 100-day eMA. EUR/USD fell to a 7-day low as bears drove it closer towards 1.2000, with its daily range was just shy of 150% of its 10-day ATR.
However, the majority of relative volatility was seen across CHF and JPY pairs as they accounted for 10 of the 12 which exceeded their 10-dy ATR’s. CHF/JPY fell from its multi-year high with a daily range over 200% of its ATR and EUR/JPY also hit similar levels of volatility during a bearish session.
Oil looks past dollar strength
Despite another dollar bullish session, the CRB commodities index rose to a fresh 20-month high with WTI and Brent leading the stampede with gains of around 1.8% (and closing both above $60). The Texas deep freeze continues to put additional upside pressure on oil prices alongside the expectations of Biden’s stimulus plans and the global vaccine rollout. With WTI above its 200-month eMA its next major resistance level is the January 2020 high around 65.65. For Brent this equates to 71.75.
Gold (XAUUSD): All eyes on 1764.73 support
Gold fell to an 11-week low overnight as bulls continued to liquidate, despite a rise in bond yields in the face of expected inflation. Whilst we remain bullish over the longer-term, price action continues to look corrective on the daily chart yet a bottom signal is not yet in sight. The 100 and 50-day eMA are capping swing highs and prices are firmly below the 200-day eMA. Prices are sitting just above the 1764.73 swing low which coincides with a 50% retracement level. Ultimately, how prices react around 1764.74 support remains key.
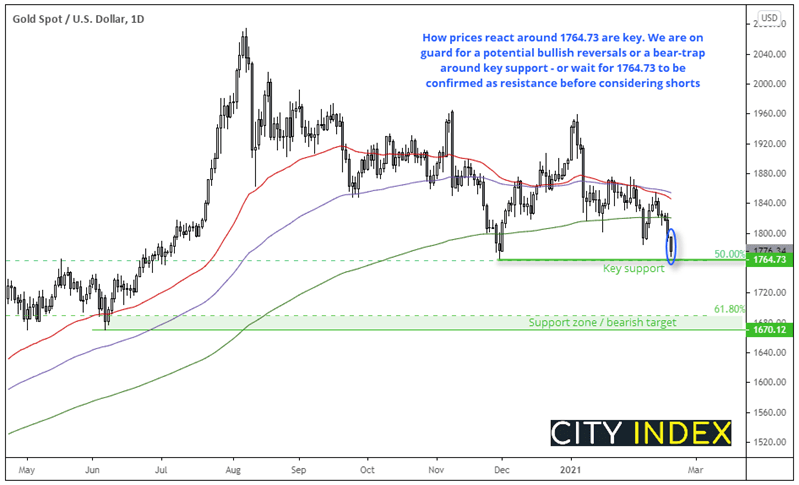
- Should momentum break beneath 1764.73 we would want to see prices accepted below this key level before considering bearish setups. This is to avoid any bear-traps to then only to see prices rebound higher.
- If 1764.73 is confirmed as resistance the next target levels for bears are around 1720 and the 1670 – 1690 zone (major swing low and 61.8% Fibonacci retracement level).
- Bulls could consider setups is we see bullish reversal candles around 1764.7 support. Or, for a more aggressive approach, wait to see if a bear trap / false break occurs before entering long with a break back above 1764.73
Up Next (Time in Sydney GMT +11)
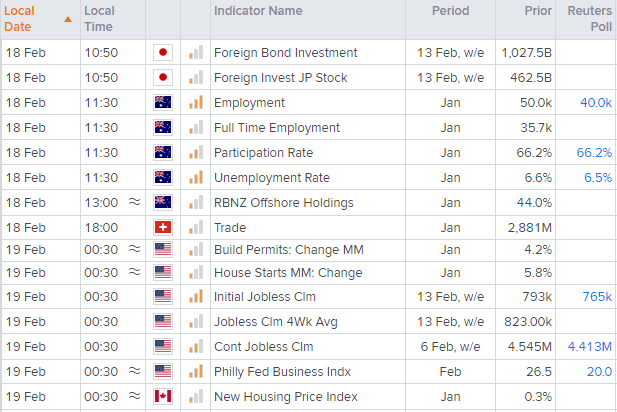
Australian employment is the main data set in Asia today. 40k jobs are expected to be created in January and the unemployment rate is forecast to fall to 6.5% (down from 6.6%). Given the RBA acknowledged in their February minutes that Q4 unemployment beat their own best-case estimates, there is some wriggle room for a rise without it causing too much of a stink. Moreover, job ads have increased for 8 consecutive months according to the ANZ report and they expect employment to remain robust within the first half of 2021 (despite JobKeeper due to end in March). So, it could take a particularly bad employment report to weigh on AUD but, even then, RBA are unlikely to ease further anyway.
Watchlist update:
USD/JPY: Prices have retraced and respected the upper bound of the 105.68 – 105.75 support zone highlighted in yesterday’s report. A break below the four-hour bullish engulfing candle at 105.75 invalidates the bullish bias. Next target for bulls is 106m recent highs and above.
CHF/JPY: The market may have tipped its hand (or, the SB in this case). A bearish engulfing candle took prices firmly back below multi-year highs outlined in Tuesday’s report. As these highs have marked large bearish reactions over prior years, this may be of interest to longer-term contrarian bears.
Latest market news
Yesterday 11:48 PM
Yesterday 11:16 PM
Yesterday 05:00 PM
Latest Equities articles
April 12, 2024 02:28 AM
April 7, 2024 08:46 PM
March 31, 2024 11:22 AM
