


Apple Inc (AAPL)

click to enlarge charts
Key Levels (1 to 3 weeks)
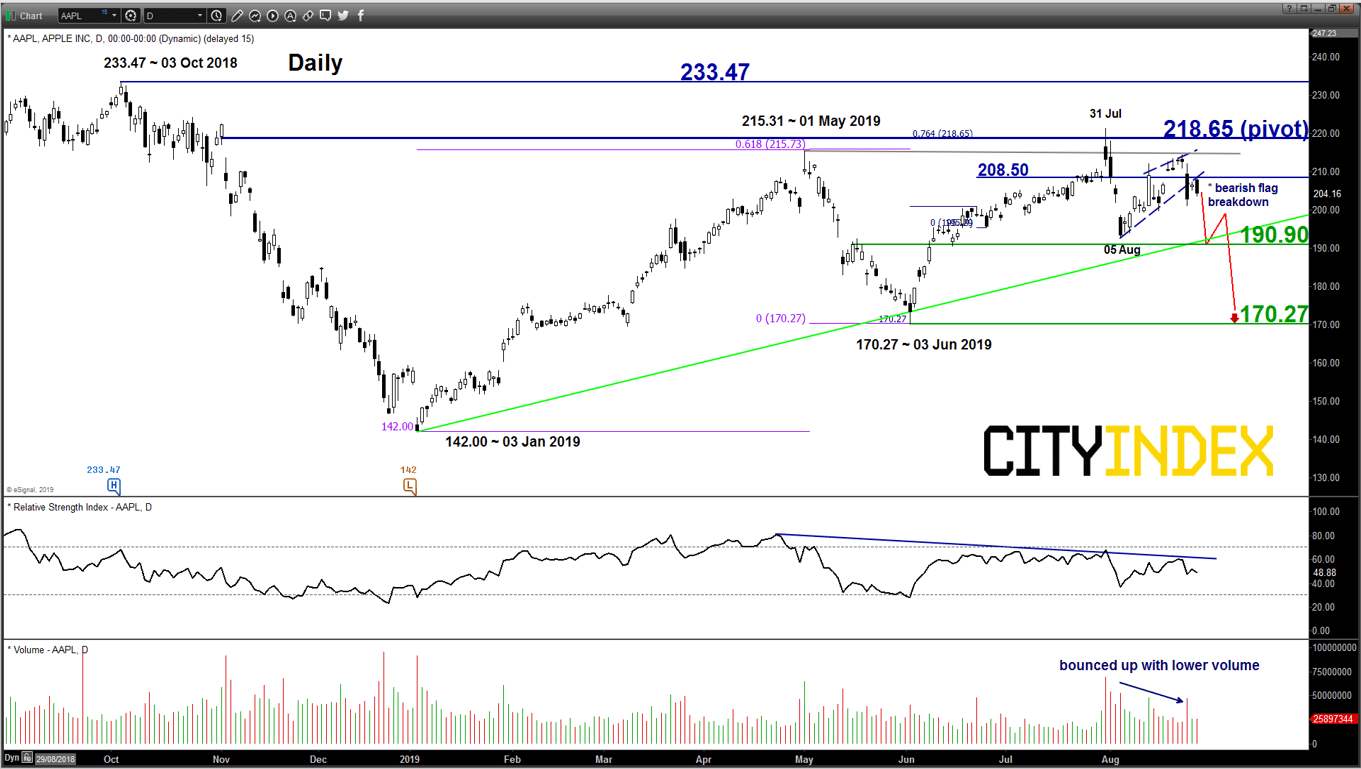
Intermediate resistance: 208.50
Pivot (key resistance): 218.65
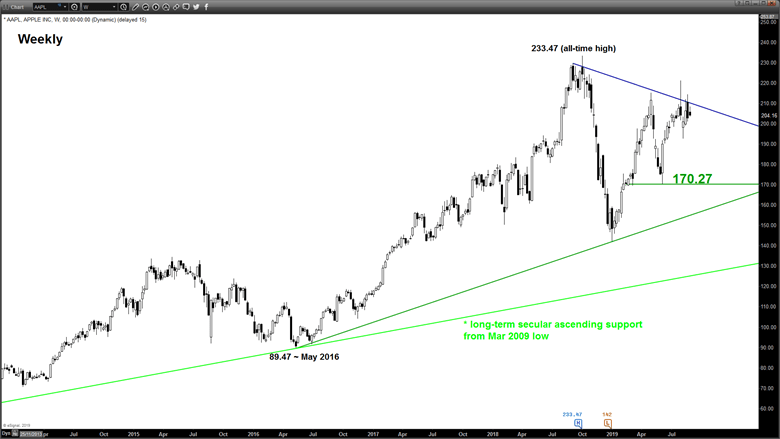
Supports: 190.90 & 170.27
Next resistance: 233.47
Directional Bias (1 to 3 weeks)
Bearish bias below 218.65 key medium-term pivotal resistance for a potential push down to test the 190.90 ascending support in place since 03 Jan 2019 low. A break below it reinforces a further down move to target the next support at 170.27 (03 Jan 2019 swing & 61.8% retracement of the up move from 03 Jan low to 31 Jul 2019 high).
However, a clearance with a daily close above 218.65 invalidates the bearish scenario for a squeeze up to retest the 233.47 current all-time high level printed on 03 Oct 2018
Key elements
- Since its 03 Oct 2018 all-time high of 233.47, AAPL has been evolving into a “triangle-liked” range configuration with the upper limit of the range at 218.65.
- The daily RSI oscillator remains negative below a corresponding resistance at the 60 level which suggests the lack of medium-term upside momentum revival.
- Recent price action has broken down below a short-term “bearish flag” configuration from 05 Aug 2019 low, retested its former range support on Mon, 26 Aug and retreated yesterday, 27 Aug coupled with a daily bearish candlestick at the end of the U.S. session.
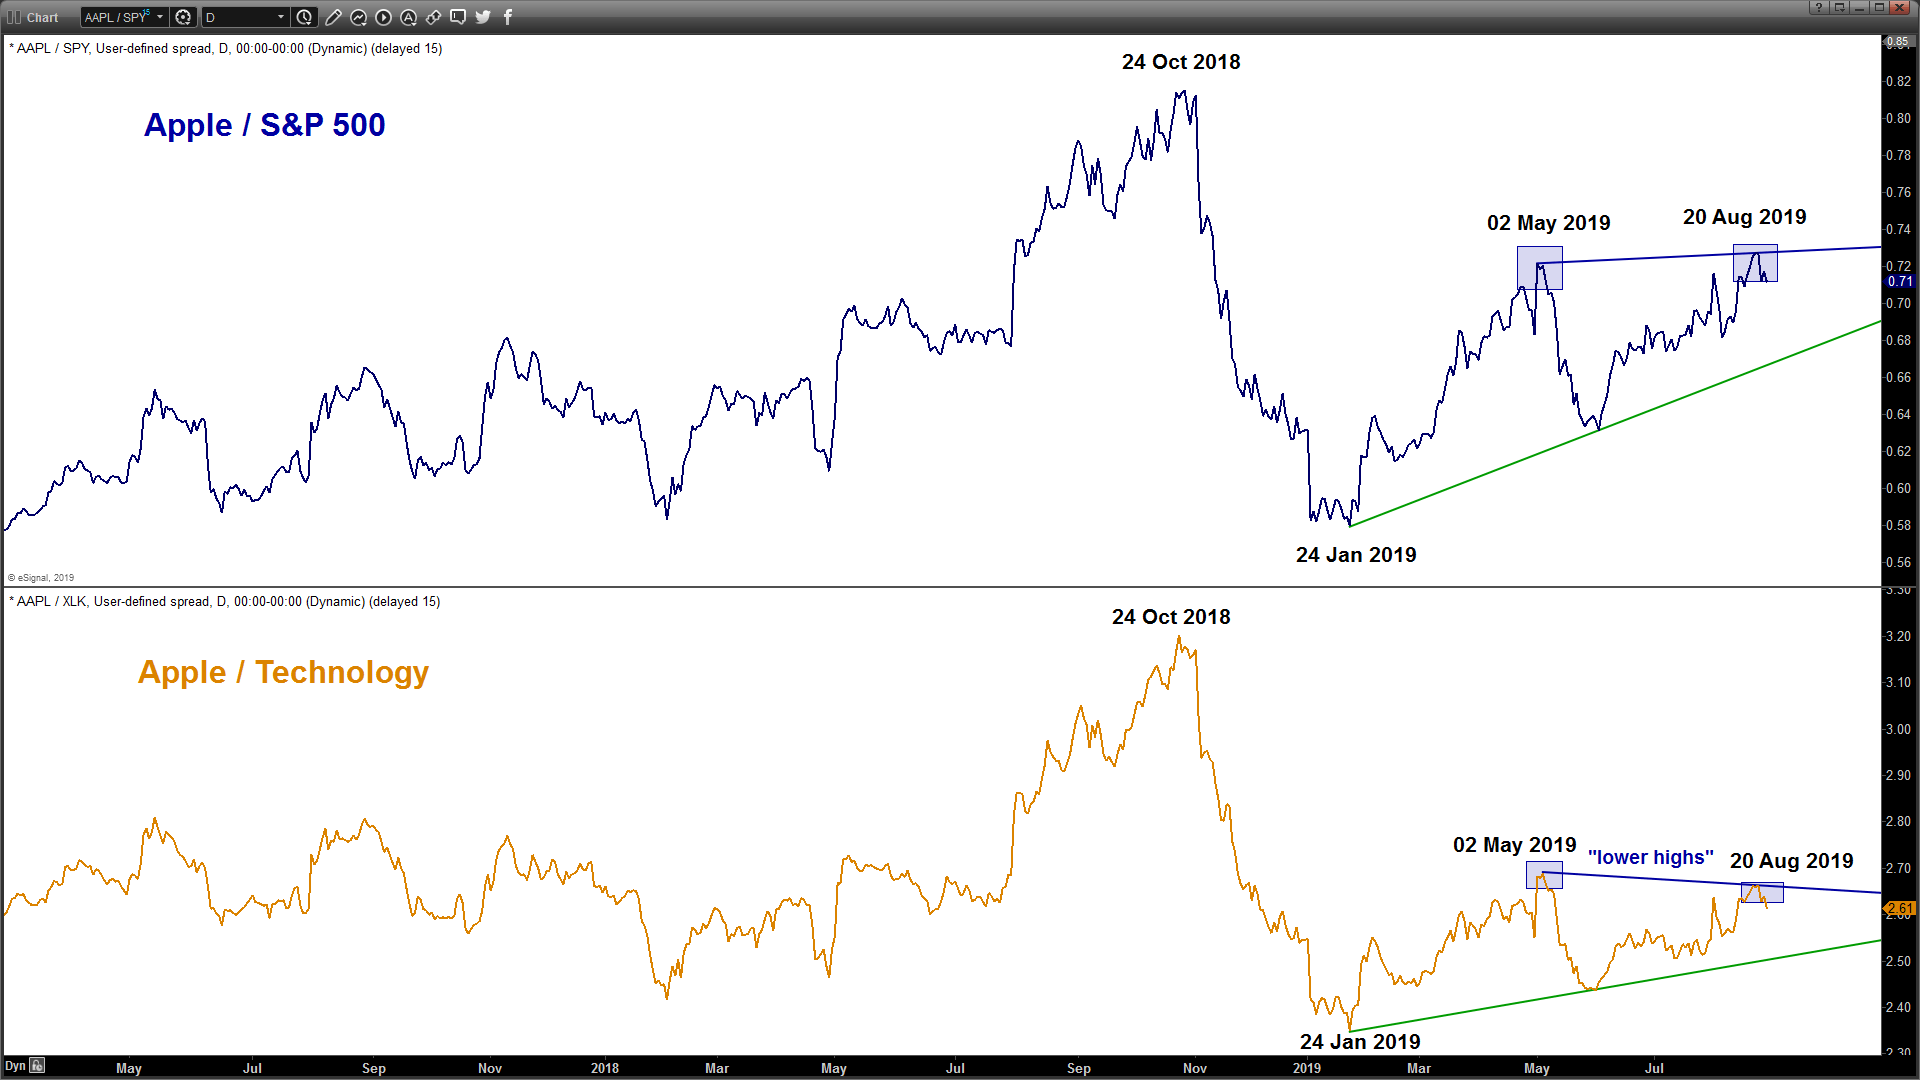
- Relative strength analysis suggests underperformance of Apple against its sector (Technology).
Charts are from eSignal
Latest market news
Today 11:14 AM
Today 08:28 AM
Yesterday 03:30 PM
Yesterday 01:23 PM
Latest Apple articles
November 3, 2023 01:22 PM
October 11, 2023 02:41 PM
September 13, 2023 10:03 AM
September 8, 2023 08:52 AM