


April 13, 2022 7:28 PM
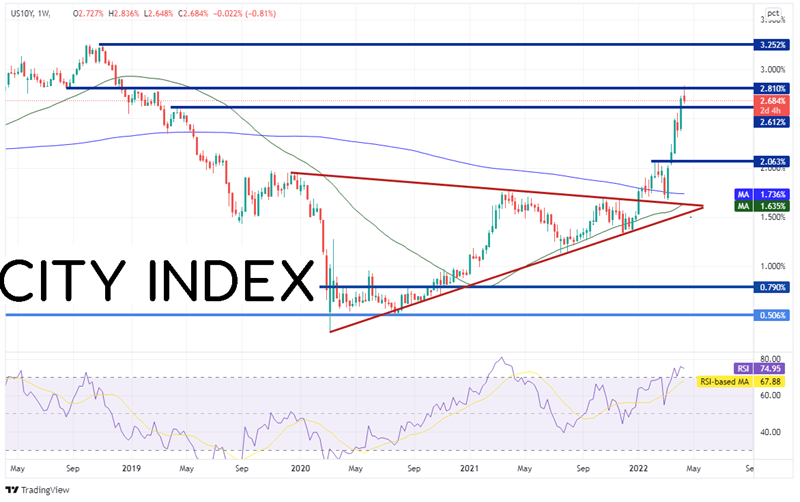
It’s not a secret that US yields have been on a tear higher as of late, however, US 10-year yields have run into a ceiling. On a weekly timeframe, 2.81% is horizontal resistance dating to December 2018. Also notice that the RSI is in overbought territory. Yields have pulled back after briefly moving higher to a high of 2.836%.
Source: Tradingview, Stone X
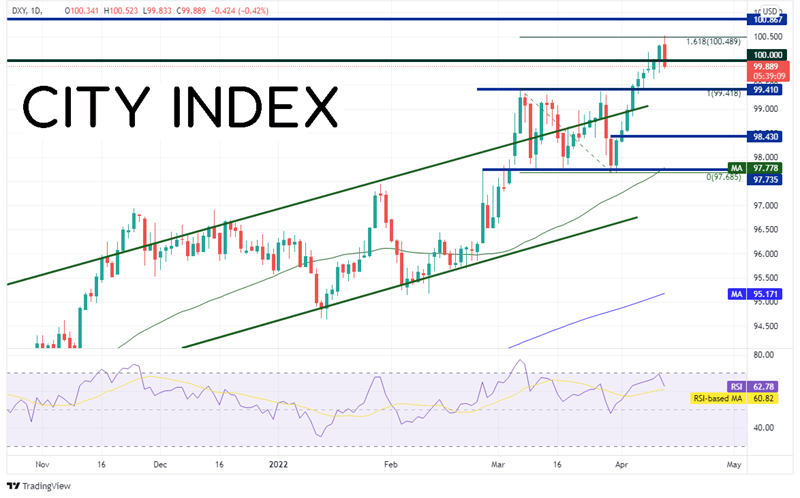
Along with the pullback in yields (which started yesterday), the US Dollar and some of its currency pairs have reversed as well. On the daily timeframe, the US Dollar Index (DXY) ran into resistance at the 161.8% Fibonacci extension from the highs of March 7th to the lows of March 30th near 100.50. Today, the daily candlestick is trying to form bearish engulfing pattern, a one candlestick reversal pattern in which the real body of the red (lower) candle engulfs the real body of the prior day’s candle. Support is at the breakout above the March 7th highs near 99.42.
Source: Tradingview, Stone X
Trade DXY now: Login or Open a new account!
• Open an account in the UK
• Open an account in Australia
• Open an account in Singapore
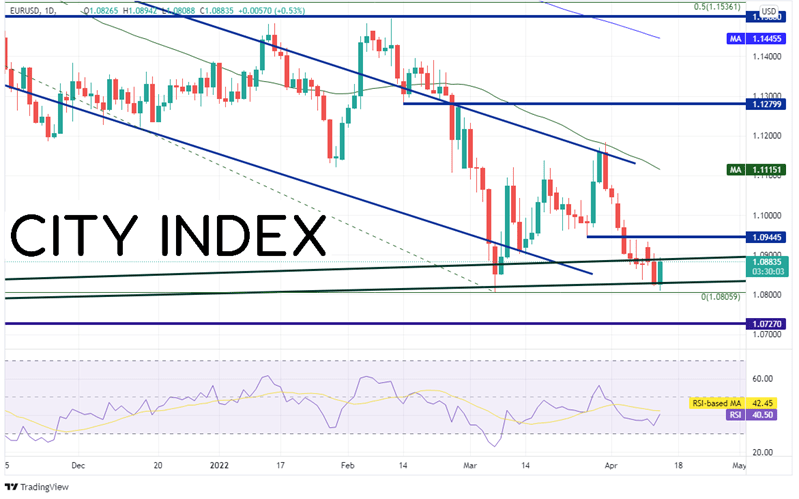
As a result of the US Dollar reversing from resistance, some of the US Dollar pairs are also reversing at key levels. EUR/USD has stalled at the lows from March 7th near 1.0805 and is moving higher today, trying to form a bullish engulfing candlestick of its own. Resistance above yesterday’s high is at 1.0945. Above there, price can move all the way to the 50 Day Moving Average at 1.1115.
Source: Tradingview, Stone X
Trade EUR/USD now: Login or Open a new account!
• Open an account in the UK
• Open an account in Australia
• Open an account in Singapore
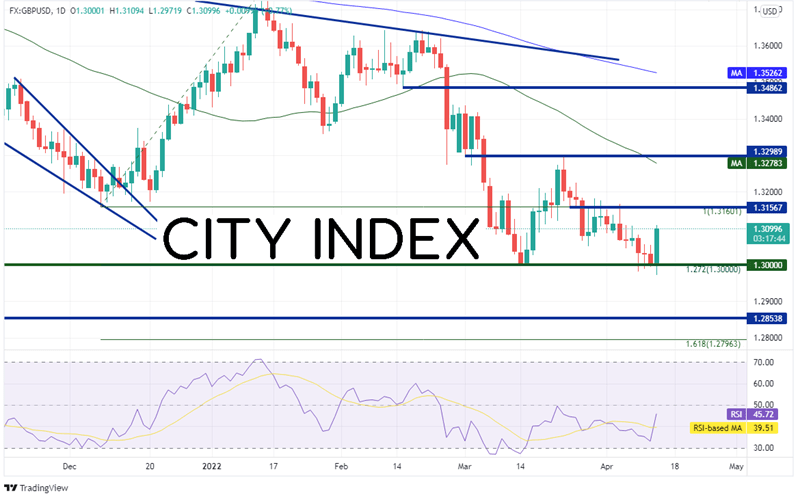
However, the biggest mover of them all today may be GBP/USD. The on the daily timeframe, the pair traded down to the 127.2% Fibonacci extension from the lows of December 8th, 2021 to the highs of January 13th at the psychological round number support level of 1.3000. After trying to push lower the last 3 days, GBP/USD took off higher today. The main reason may be that the UK CPI came in much hotter at 7% YoY vs 6.7% YoY expected an 6.2% in February. However, throw in the US Dollar weakness and it makes for a perfect storm for GBP/USD. The pair made a new local low today at 1.2972 and is in a 140-pip range. The GBP/USD also has formed a bullish engulfing pattern. Horizontal resistance is at the previous breakdown level near 1.3157, then the 50 Day Moving Average at 1.3278. Horizontal support below today’s low is at 1.2854, dating to November 2020, then the 161.8% Fibonacci extension from the recently mentioned timeframe at 1.2796.
Source: Tradingview, Stone X
Trade GBP/USD now: Login or Open a new account!
• Open an account in the UK
• Open an account in Australia
• Open an account in Singapore
Yields ran into resistance this week near 2.81% and pulled back. Today, the US Dollar took its turn to move lower. As a result, many of the US Dollar pairs moved in the opposite direction. Watch for support in the DXY to see if the US Dollar will continue to move lower.
Learn more about forex trading opportunities.
Latest market news
Today 11:14 AM
Today 08:28 AM
Yesterday 03:30 PM
Yesterday 01:23 PM
Yesterday 11:00 AM
Latest DXY articles
April 23, 2024 11:01 PM
April 23, 2024 04:19 AM
April 10, 2024 11:24 PM
April 8, 2024 03:35 AM