


April 6, 2022 5:04 AM
U.S yields punched to fresh cycle highs overnight on robust economic data and hawkish commentary from Fed Governor Brainard.
Brainard said that balance sheet reduction would begin "at a rapid pace as soon as our May meeting" and expects the balance sheet to shrink "considerably more rapidly than in the previous recovery."
Brainard's speech comes before the release of March FOMC Minutes tomorrow morning and carries extra weight as she is renowned as one of the more 'dovish' members on the board.
10-year Treasury yields increased 15bp to 2.55%, their largest one day rise since March 2020, after being as low as 1.66% just one month ago.
In this article here two weeks ago, we noted St. Louis President Bullard's comparison of the current cycle to the 1994 tightening cycle when the Fed raised rates from 3.25% to 6% over 12 months. At the time, the inflation rate was at ~2.50% vs 7.9% currently.
During that period, the stock market fell 10% and then traded sideways for the remainder of the year as the speed of the tightening cycle and rise in yields caused indigestion issues for the stock market. More recently, a rapid rise in yields caused equity market mayhem in January 2018 and again in October 2018.
As I see it, the problem is that the selloff in the bond market (yields rising) is accelerating, meaning that an already troubling backdrop is deteriorating for the S&P500.
Not wanting to pre-empt a possible turn lower, we move to a short term tactical bearish bias in the S&P500 on a sustained close below the 200-day moving average currently at 4480/75.
The bearish call would increase in a conviction on a daily close below support at 4420/00, and the downside target in this instance would be a retest of support at 4130/4100.
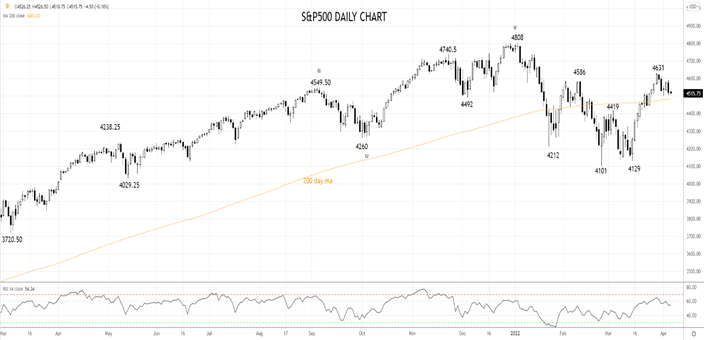
Source Tradingview. The figures stated are as of April 6th 2022. Past performance is not a reliable indicator of future performance. This report does not contain and is not to be taken as containing any financial product advice or financial
How to trade with City Index
You can trade with City Index by following these four easy steps:
-
Open an account, or log in if you’re already a customer
• Open an account in the UK
• Open an account in Australia
• Open an account in Singapore
- Search for the company you want to trade in our award-winning platform
- Choose your position and size, and your stop and limit levels
- Place the trade
This content will only appear on Forex websites!
Latest market news
Yesterday 01:23 PM
Yesterday 06:01 AM
April 18, 2024 11:27 PM
Latest Stocks articles
April 17, 2024 11:00 AM
March 21, 2024 04:05 AM
March 7, 2024 05:03 AM
February 7, 2024 05:52 PM