


September 28, 2021 1:11 PM
What’s “driving” GBP and where is it headed?
Growth in the UK seems to have moved into the slow lane as gasoline shortages and lack of truck drivers are causing the GBP to crash. The panic at the pump is causing prices to rise and even causing some stations to close, as their wells to run dry. BP has also said that they may temporarily close petrol stations due to the lack of truck drivers. (See my colleague Tony Sycamore recap of the fuel panic here.) The fear and uncertainty is hitting the currency markets and causing the Pound to move lower.
Trade GBP/USD now: Login or Open a new account!
• Open an account in the UK
• Open an account in Australia
• Open an account in Singapore
On a weekly timeframe, GBP/USD has moved to its lowest level since January. Price has stalled just above horizontal support from the highs of December 2019, near 1.35149. There is a band of support below, which extends down to 1.3483. However, if price breaks below, it can run to the 38.2% Fibonacci retracement level from the March 2020 low to the February high near 1.3159. The 200-week Moving Average also crosses near that level at 1.3157.
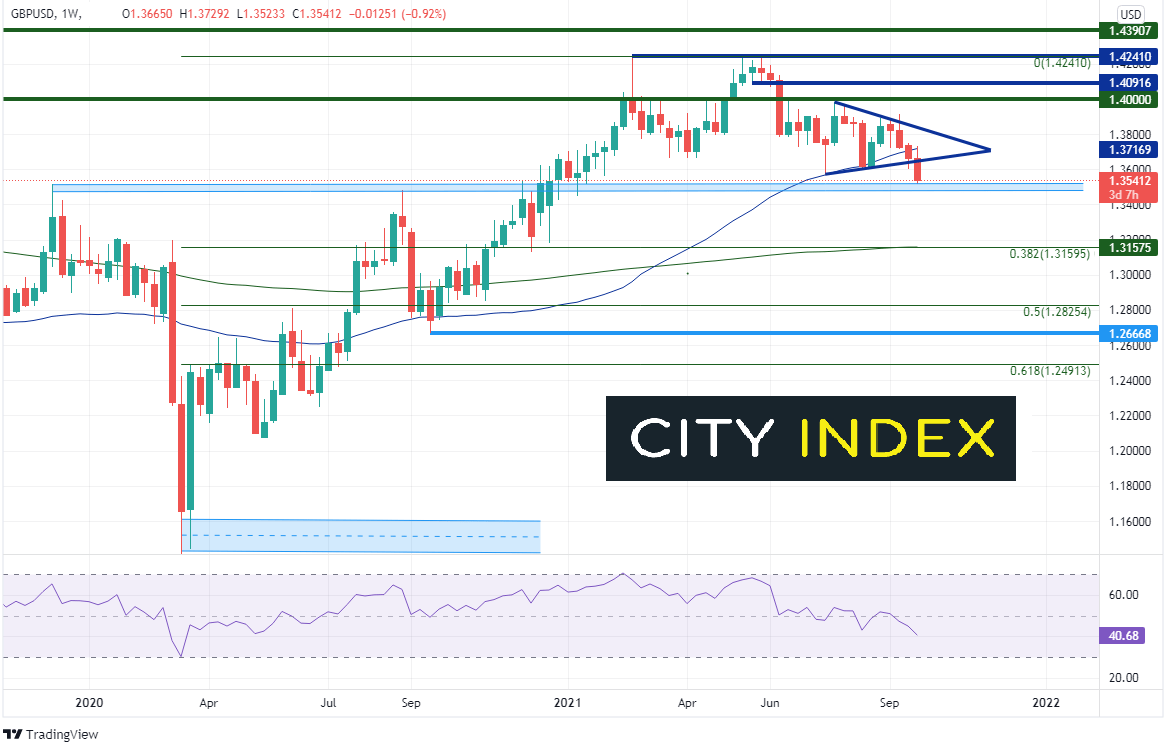
Source: Tradingview, Stone X
On the Daily timeframe, GBP/USD has broken down from a symmetrical triangle and is nearing the previously mentioned support on the weekly timeframe. Resistance above is at the September 22nd lows of 1.3609 and then the upward sloping trendline of the symmetrical triangle near 1.3650. Above there, today’s highs provide the next resistance level at 1.3717.
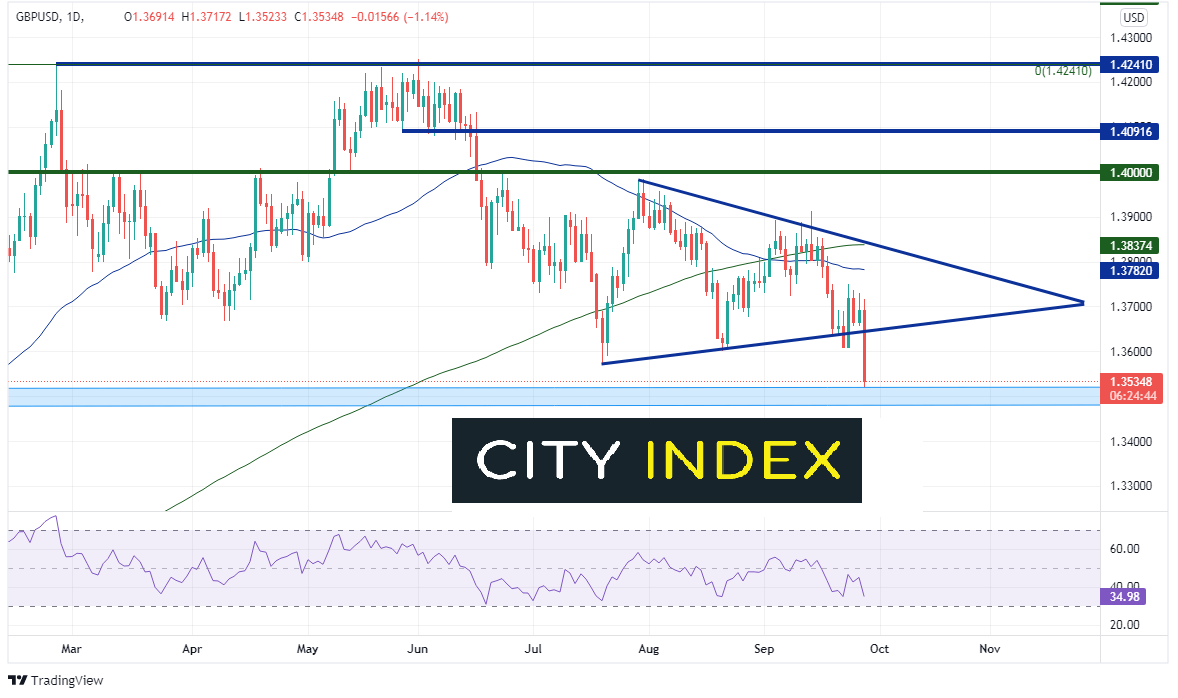
Source: Tradingview, Stone X
The US Dollar isn’t the only currency that the Pound has sold off against. EUR/GBP put in a high on April 26th near 0.8719 and has been moving lower since then in an orderly channel. Yesterday, EUR/GBP closed mid-range ion the channel and below the 50 Day Moving Average near 0.8541. However, with today’s selloff in the Pound, EUR/GBP moved aggressively higher, above the top, downward sloping trendline of the channel and is testing the 200-Day Moving Average at 0.8647. Above there, horizontal resistance is at 0.8670 and then the April 26th highs at 0.8719. Intraday support is at the September 22nd highs of 0.8613, ahead of yesterday’s highs and the top, downward trendline of the channel near 0.8579 and then the 50-Day Moving average at 08541.
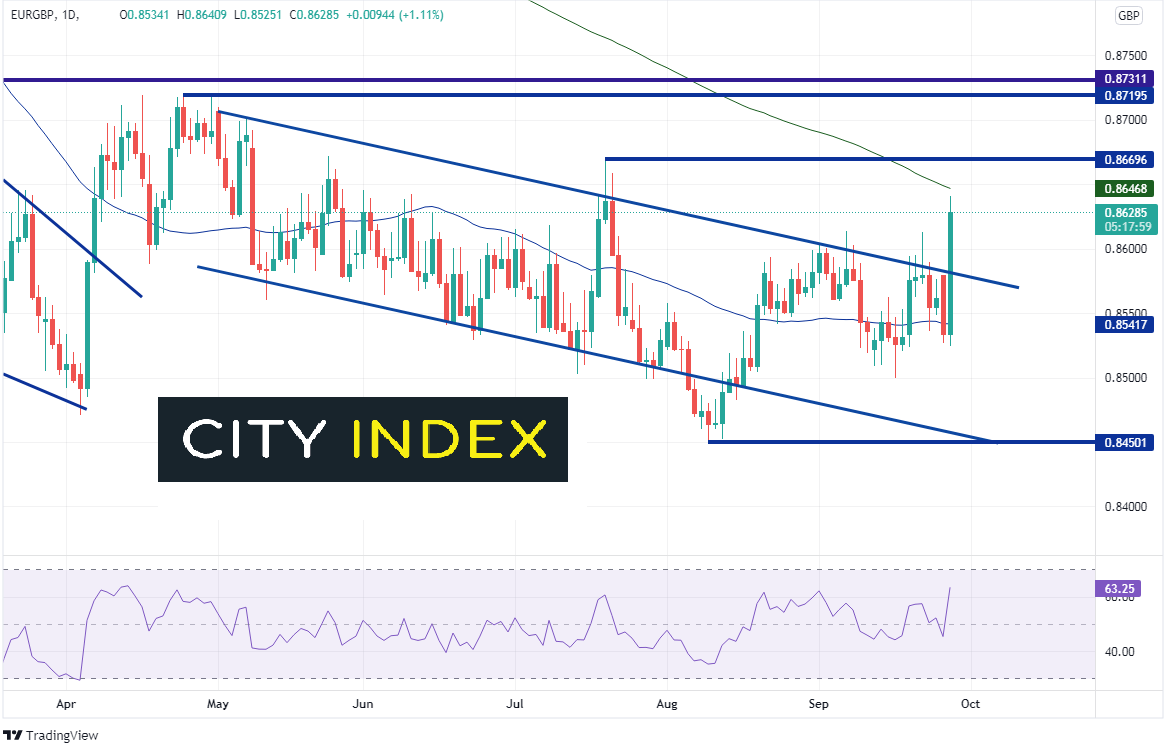
Source: Tradingview, Stone X
If the fears continue that there will be a continued shortage of gasoline at the pumps and gas companies continue to have a shortage of truck drivers, the Pound may continue to fall. However, if the supply chain loosens and gas beings moving again or if inflation fears from the rising costs of oil overtake the fear of lack of supply, GBP could reverse and head higher!
Learn more about forex trading opportunities.Latest market news
Yesterday 03:30 PM
Yesterday 01:23 PM
Yesterday 11:00 AM
Yesterday 08:15 AM
Latest Forex articles
Yesterday 11:00 AM
April 23, 2024 11:09 PM
April 23, 2024 04:00 PM