


March 3, 2021 4:48 PM
USD/ZAR may be ready for a breakout
With the strengthening of US yields over the past week, emerging market currencies, such as the South African Rand, have taken a hit as it threw the world into a bit of uncertainty. However, central bank speakers are trying to calm the markets by repeating the company slogan that rates are rising because of confidence in the recovery. In addition, continued talk fiscal stimulus, including the $1.9 trillion US recovery package, combined with an increased view on the vaccine rollout, is giving investors hope that “things” will get better. In this backwards world, that means unwinding of monetary stimulus, leading to lower stock prices and a higher US Dollar.
USD/ZAR has been in a descending channel since early April 2020. On September 29th, price began putting in lower highs and formed a descending wedge. However, on December 17th, 2020, price hit horizontal support from late 2019, and held near 14.5114. Price traded off that level numerous times in late December and February, finally breaking out above the top, downward sloping trendline of the wedge on February 25th (the day bond yields spiked).
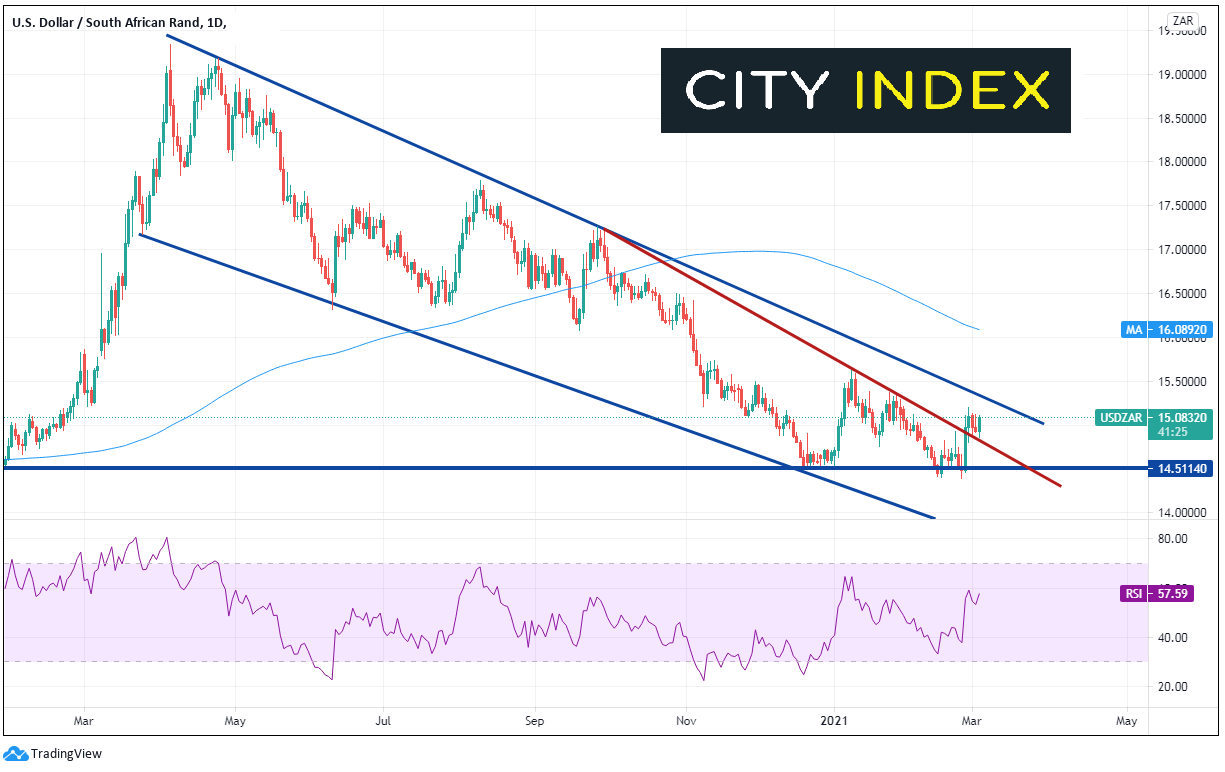
Source: Tradingview, City Index
Forex market hours: when is the best time of day to trade forex?
On a 240-minute timeframe, after price broke above the trendline, it traded as high as 15.19675 before pulling back in a flag formation. Price held the 38.2% Fibonacci retracement from the February 24th lows to the February 26th highs near 14.8748, which is considered a weak pullback. This is now the first level of support. Below there, support is back at the downward sloping trendline from the wedge near 14.8100 and the 50% retracement level near 14.7785. However, price is currently at the top of the flag and appears ready to breakout. If it does, resistance is at the February 26th highs and then the downward sloping trendline for the long-term channel on the daily timeframe, near 15.3000. The target for a flag pattern is the length of the flagpole added to the breakout point of the flag, which in this case is near 15.5700.
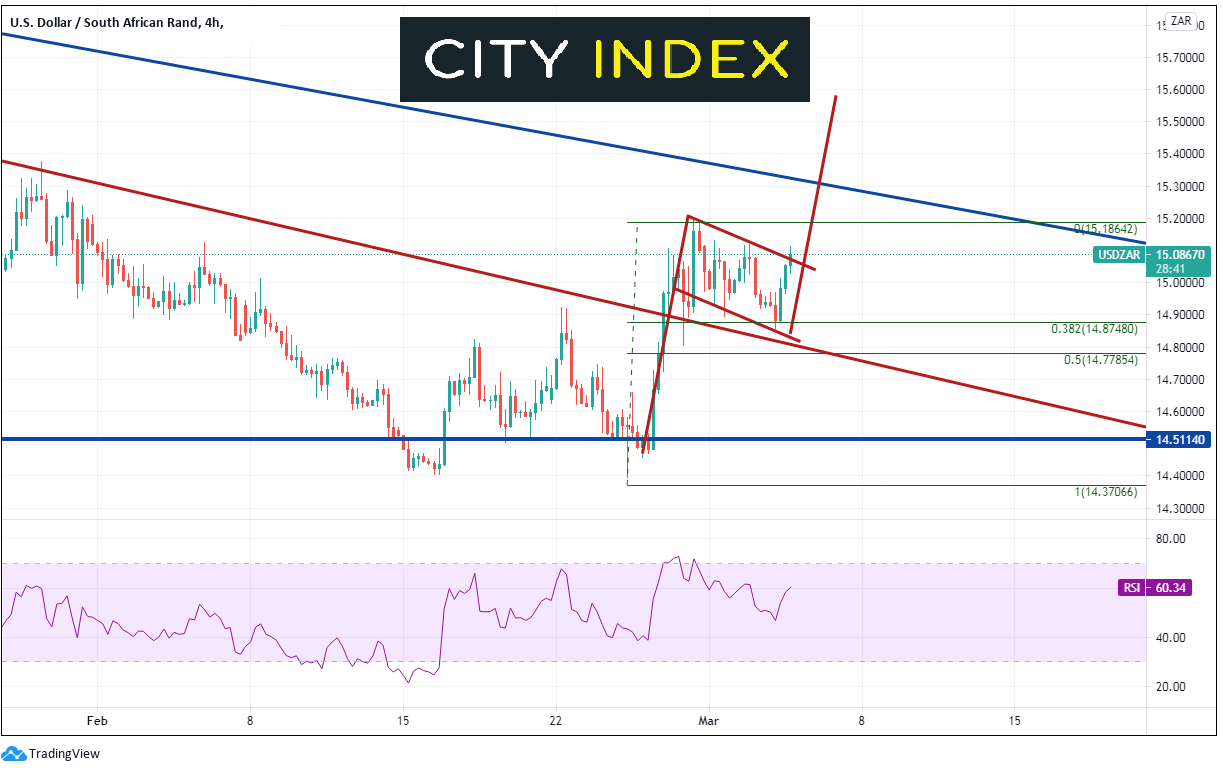
Source: Tradingview, City Index
If yields continue to rise, it may pull the US Dollar along for the ride. With a stronger US Dollar, USD/ZAR could break out of its flag pattern on the 240-minute timeframe and be on its way to the flag target.
Learn more about forex trading opportunities.
Latest market news
Yesterday 11:48 PM
Yesterday 11:16 PM
Yesterday 05:00 PM
Latest Forex articles
Yesterday 04:47 AM
April 16, 2024 12:00 PM
April 16, 2024 04:24 AM