


June 21, 2022 8:35 PM
Last week, the BOJ met for its interest rate decision meeting. Expectations were for unchanged, however, not too many people were expecting BOJ Governor Kuroda leaning dovish. In addition, to reaffirming the BOJ’s commitment to yield curve control and daily bond purchases, Kuroda also said that the central bank will take additional easing steps as needed! This is opposite many central banks around that world that currently are tightening monetary policy. On Monday, he changed his tune when he met with Prime Minister Kishida and said that recent rapid yen moves were undesirable. However, the damage has been done. Kuroda, Kishida, and Japan Finance Minister Suzuki have been trying to talk up the Yen for months. And though they had been successful for a while, today USD/JPY reached its highest levels since 1998, taking out the 2002 highs of 135.16.
Everything you need to know about the Bank of Japan
What can cause the pair to move lower? IF BOJ actually does intervene in the markets, the Yen would swiftly move higher, causing USD/JPY to move lower. In addition, Fed Chairman Powell testifies tomorrow in front of the Senate Banking Committee. Any new, less hawkish comments could cause the US Dollar to move lower. In addition, the correlation coefficient between USD/JPY and 10 Year US Yields is +0.91. Readings above +0.80 are considered to be strong, positive correlations. Therefore, if US yields pull back, USD/JPY should move with it. Finally, on Friday Japan releases CPI. Expectations are 2.3% YoY for the headline number and 2.1% YoY for the Core print. If actual readings are higher than expected, USD/JPY could pull back.
USD/JPY has been moving aggressively higher since mid-March when it was at 116.35 (not shown). On May 9th, the pair made a high of 131.35, just 50 pips under resistance from 2002. USD/JPY then pulled back in a descending wedge formation. On May 31st, the pair broke above the top trendline of the pattern and continued its march higher. The pair took out the 2002 highs on June 14th, however the move failed. That is, until today. Today, USD/JPY is up nearly 160 pips, reaching its highest level since October 1998 near 136.60. First resistance is at the October 1998 highs at 136.98. Above there is horizontal resistance from August 1998.
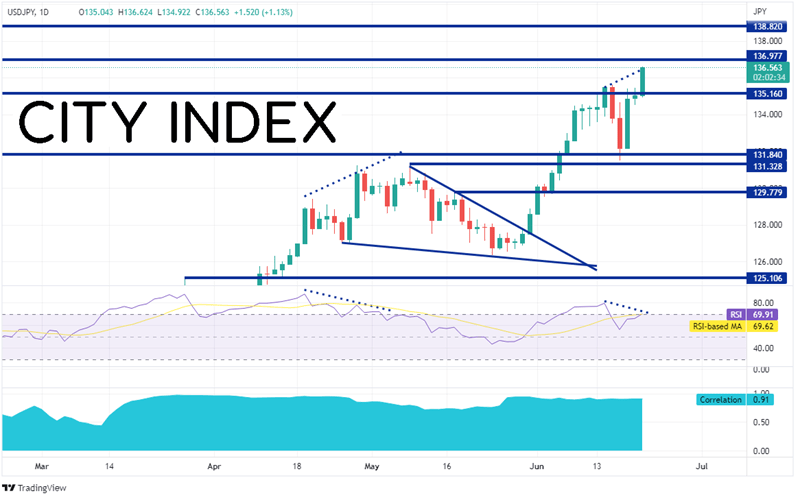
Source: Tradingview, Stone X
Trade USD/JPY now: Login or Open a new account!
• Open an account in the UK
• Open an account in Australia
• Open an account in Singapore
However, notice the RSI on the daily timeframe is diverging with price. When this happened is late April/early May, price pulled back into the descending wedge formation. Will this happen again? If so, first support is at the highs from June 14th at 135.47. Below there, the next level of support is at the lows of June 16th and the previous highs from May 9th at 131.33, and then horizontal support at 128.78.
USD/JPY has been on a tear since March 31st. Will it continue higher? The next move for the pair may depend on Japan fx intervention, comments from Powell, Japan CPI, or an overbought RSI.
Learn more about forex trading opportunities.
Latest market news
Today 11:14 AM
Today 08:28 AM
Yesterday 03:30 PM
Latest Forex articles
Yesterday 11:00 AM
April 23, 2024 11:09 PM
April 23, 2024 04:00 PM