


January 16, 2020 11:19 AM
USD/JPY higher as Philly Fed and Retail Sales Data is Stronger
The Philadelphia Fed Manufacturing Index for January was released earlier today, and it showed a strong uptick in activity at a reading of 17 vs a reading of 4 expected. This is the strongest reading since May 2019. Current new orders increased 7.1 points and the shipments index rose 7.7 points. The stronger than expected advance in activity may be due to the agreement of the US-China trade deal agreement in December, and it’s expected signing yesterday. In addition, although Retail Sales (MoM) for December was in line was expectations, the Core Retail Sales was 0.7% vs and expectation of 0.3%. Core retail sales excludes the volatile autos component of the data. Along with retailer earnings, this may indicate a strong holiday shopping season.
As a result of the data, today stocks have opened at or near all time highs once again. With the markets in risk on mode, USD/JPY is higher as well. However, one must be weary of how much further USD/JPY can extend on the upside. The weekly chart shows that price has been in a downtrend since mid-2015 and is currently testing the underside of the downward sloping trendline and the 200 Week Moving Average near 110.10.
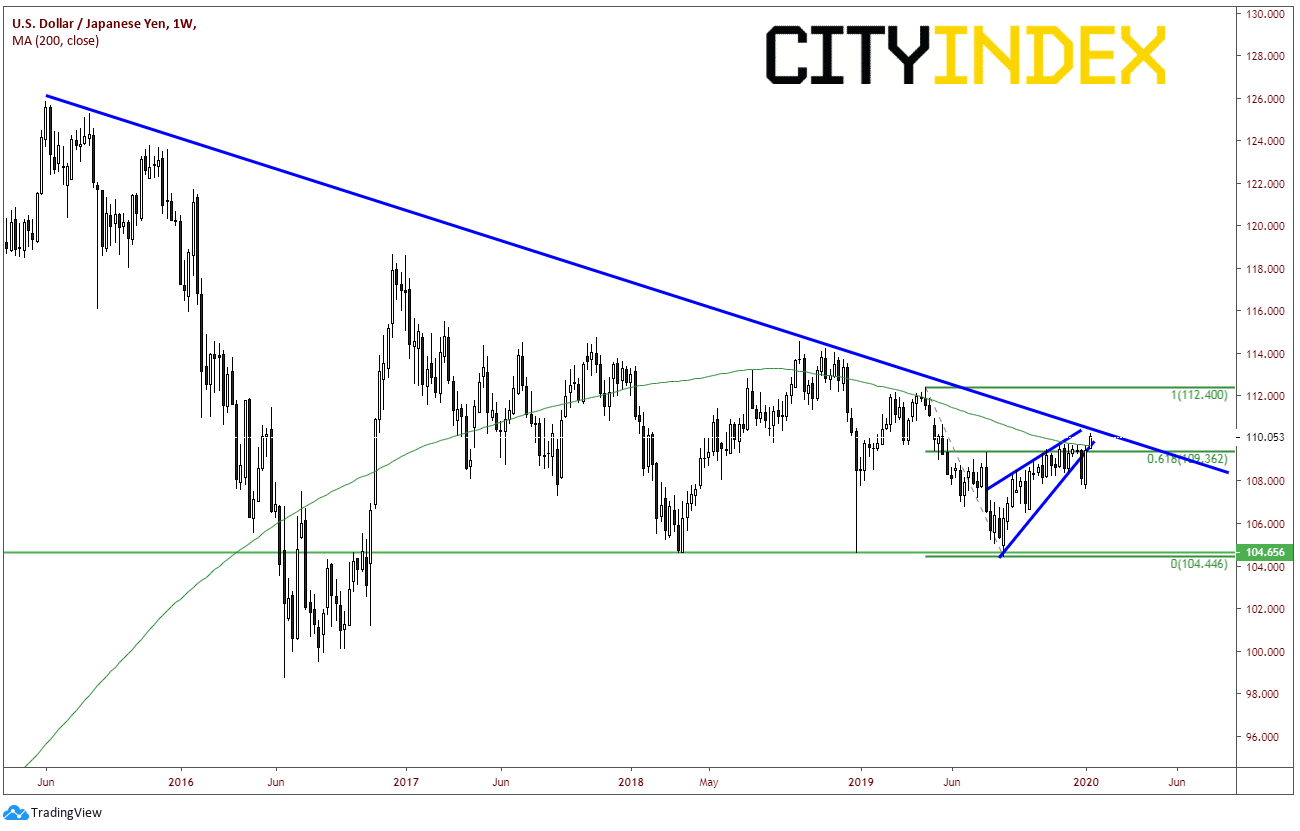
Source: Tradingview, City Index
A daily chart shows that price stalled near last year’s JPY flash crash low at 104.65 on August 26th, 2019, and has been bouncing towards the trendline since then, forming a rising wedge. 109.40/70 was a strong resistance level on the move higher, and now acts as support. As previously mentioned, USD/JPY is currently testing the long-term trendline, as well as, the upper end of the rising wedge. If resistance holds and the pair breaks back below the rising wedge (it did once, only to bounce back into the wedge), the target for the wedge would be a full retracement back to 104.65. However, price would need to break horizontal support at the 109.40/70 level, the 200 Day Moving Average and horizontal support near 108.60, and recent lows near 107.60. If price manages to break higher above the downward sloping trendline near 110.30, price can run up to the gap at 110.90/111.00. Above there, resistance comes across at the previous highs from late April 2019 near 112.40.
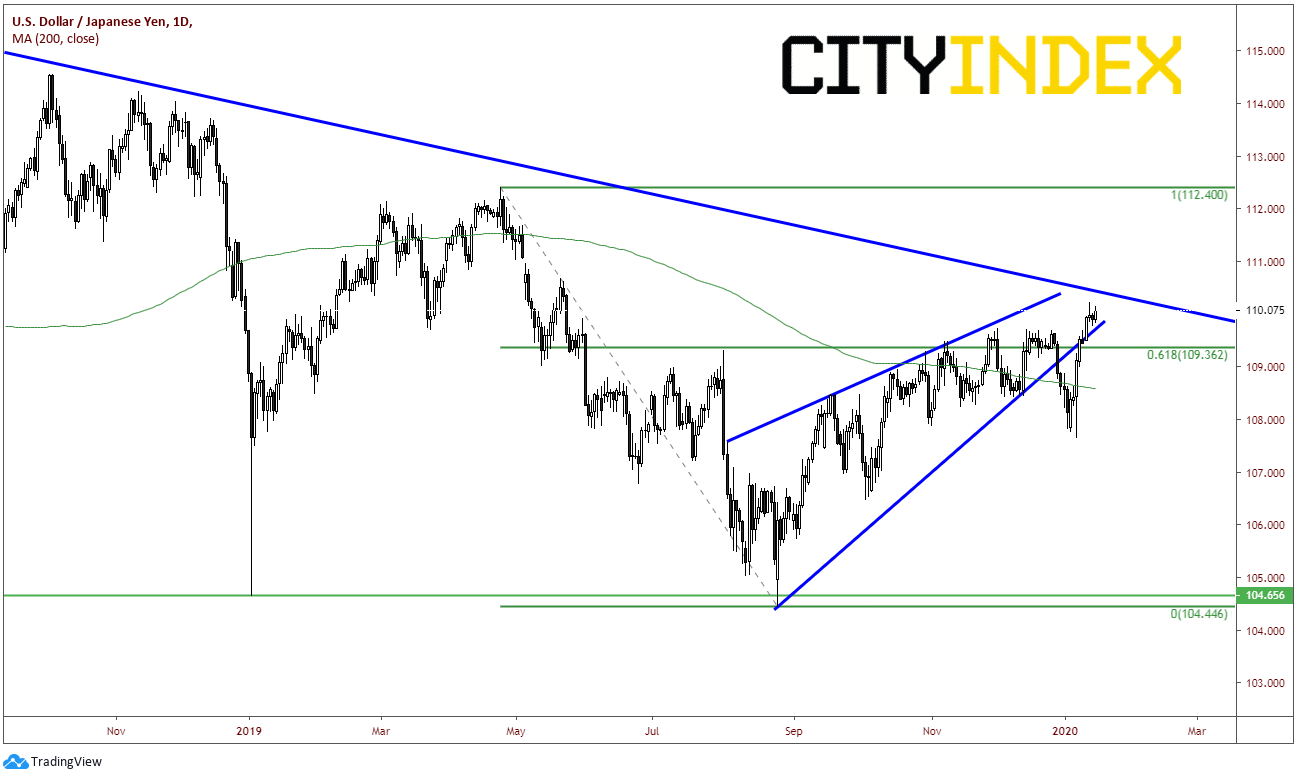
Source: Tradingview, City Index
As we wrote about yesterday when discussing the US-China trade deal signing, the S&P 500 is at critical resistance near the Golden Fib 161.8% retracement level of 3335. This coincides nicely with the resistance in USD/JPY. If stocks manage to push higher, is could bring USD/JPY with it. If it is rejected and stocks move lower, USD/JPY could be on its way back towards the 200 Day Moving Average.
Latest market news
Latest Dollar articles
Yesterday 06:20 AM
February 16, 2024 11:30 AM
February 7, 2024 03:30 PM
February 2, 2024 02:00 PM