


October 10, 2022 9:10 PM
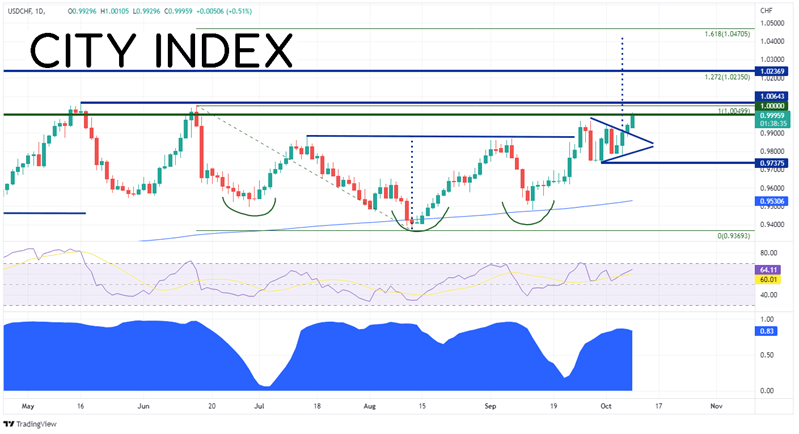
USD/CHF traded above 1.0000 today for the first time since June 15th and is aiming to take out the highs of May 16th at 1.0064. Prior to that, the pair hasn’t traded above parity since May 2019. Is now the time for USD/CHF to take out the 16th highs? Notice that the pair formed an inverse head and shoulders pattern and broke the neckline on September 26th near 0.9886. The target for this pattern is the height from the neckline to the head, added to the breakout point. Therefore, the target is near 1.0425. After breaking the neckline, USD/CHF consolidated between 0.9738 and 0.9965 in a pennant formation for the next 8 trading sessions. On Friday, USD/CHF broke above the top trendline of the pennant and continued higher on Monday, taking out the psychological round number resistance level at 1.0000. If the pair is to continue to move higher, the first resistance above parity is the May 16th highs at 1.0064. Above there, resistance is at the 127.2% Fibonacci extension from the highs of June 15th to the lows of August 11th, near 1.0235. This is also horizontal resistance from the highs of the spring 2019. If the target for the inverted head and shoulders is reached, the next resistance level is the 161.8% Fibonacci extension from the previously mentioned timeframe at 1.0471. First support is at the top trendline of the pennant near 0.9885. Below there, the next support level is at the bottom trendline near 0.9785 and then the lows form September 30th at 0.9738.
Source: Tradingview, Stone X
Trade USD/CHF now: Login or Open a new account!
• Open an account in the UK
• Open an account in Australia
• Open an account in Singapore
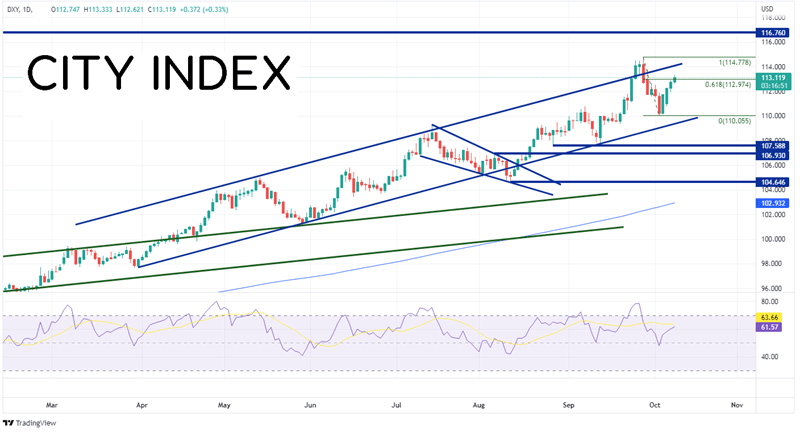
USD/CHF is traditionally highly correlated with the US Dollar. Therefore, when the US Dollar Index moves higher, so does USD/CHF. The bottom panel of the chart above shows the correlation between USD/CHF and the DXY. The correlation coefficient is currently +0.83. Readings above +0.80 are considered strong. Therefore, if the DXY continues to move higher, USD/CHF should move higher with it. The DXY has been trading in an aggressive upward sloping channel since late March, when the index was near 97.69. More recently, on September 26th, the DXY broke above the top trendline of the channel and reached a 20 year high at 114.78. It then pulled back inside the channel with a bearish engulfing candlestick and moved towards the bottom trendline. Since then, it has been on the move higher once again, taking out the 61.8% Fibonacci retracement from the September 28th highs to the October 4th lows at 112.97. The DXY appears on its way towards testing the September 28th highs! First resistance is at the top trendline of the channel near 114.10. Above there is the previous high at 116.78 and then resistance from April 2002 at 116.76. However, if the DXY pulls back, first support isn’t until the lows of October 4th at 110.06. Below there, price can fall to the bottom trendline of the channel near 109.40, then horizontal support at 107.59.
Source: Tradingview, Stone X
Trade the DXY now: Login or Open a new account!
• Open an account in the UK
• Open an account in Australia
• Open an account in Singapore
USD/CHF tested parity today. Will it continue higher? The key as to where USD/CHF goes next may be in the DXY. The 2 assets are highly correlated. Therefore, if the DXY continues to move higher, it may bring USD/CHF along with it!
Learn more about forex trading opportunities.
Latest market news
Yesterday 01:23 PM
Yesterday 06:01 AM
April 18, 2024 11:27 PM
April 18, 2024 04:46 PM
Latest Trade Ideas articles

April 18, 2024 11:27 PM
April 18, 2024 04:46 PM