


November 9, 2021 4:23 PM
According to the BLS, the Producer Price Index (PPI) measures the average change over time in the selling prices received by domestic producers for their output. The prices included in the PPI are from the first commercial transaction for many products and services. Theoretically, PPI filters down to the CPI, which is the average change over time in the prices paid by urban customers for a market basket of consumer goods and services. Companies pass higher prices they paid down to consumers. Therefore, PPI is often viewed as a leading indicator for CPI.
October’s PPI YoY print was 8.6% vs 8.6% in September, however slightly missed expectation of 8.7%. This is the highest level since November 2010. The Core PPI for October YoY was 6.8%, again matching September’s print. Expectations were in-line. This remains the highest level ever for the core reading.
Tomorrow October’s CPI will be released. The headline YoY expectation is 5.8% vs 5.4% in September. The core inflation rate is expected to be 4.3% vs 4.0% in September.
Does the leveling off in PPI mean that in a few months’ CPI will begin leveling off as well? And could it even be a peak in inflation?
Trade USD/JPY now: Login or Open a new account!
• Open an account in the UK
• Open an account in Australia
• Open an account in Singapore
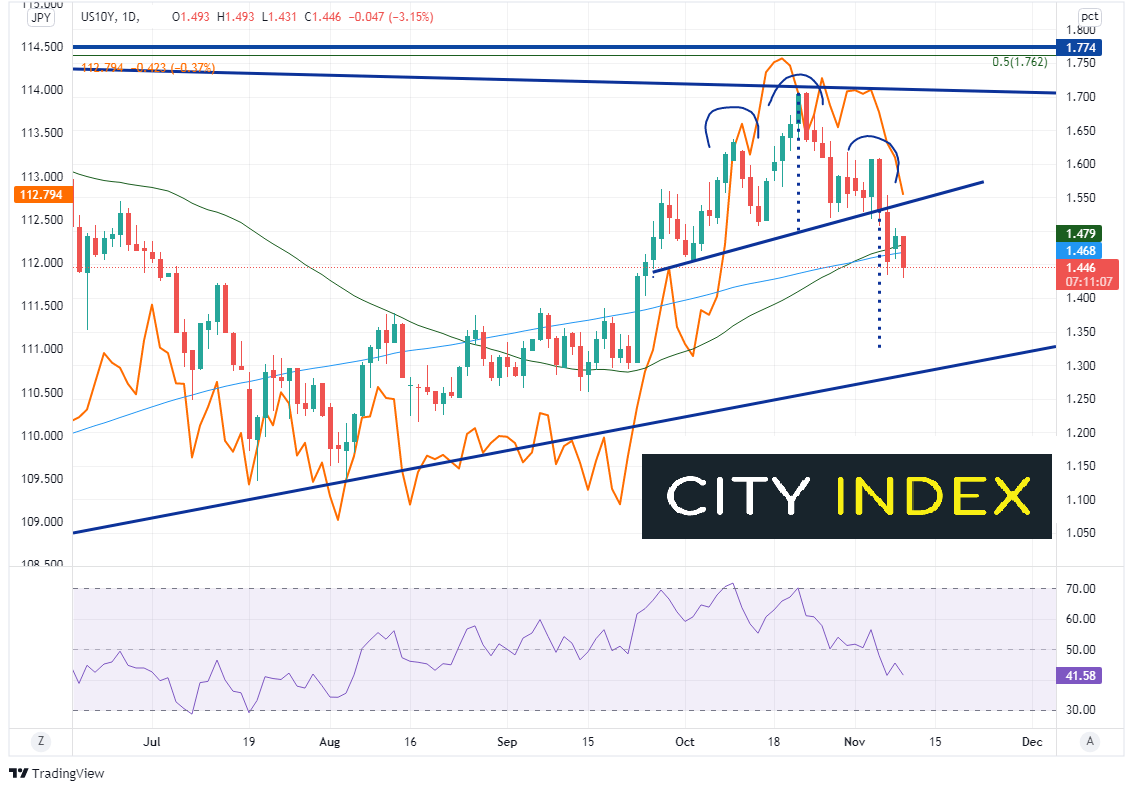
As we often discuss, US 10-year yields and USD/JPY often move together. On the 10-year yield chart below, the orange line on the chart is the price action for USD/JPY. It’s easy to see how the 2 assets move with one another. Yields reached a recent high of 1.704% on October 21st and pulled back to the neckline of a head and shoulders pattern as the November 3rd FOMC meeting approached, near 1.55%. On November 4th, 10-years broke the neckline of a head and shoulders pattern and are on their way towards target near 1.33%. Note that today yields broke through both the 50- and 200-Day Moving Averages at 1.479% and 1.468%. A close below these levels would be bearish for US yields, and therefore, USD/JPY. Support is at 1.378% and an upward sloping trendline at 1.29%.
Source: Tradingview, Stone X
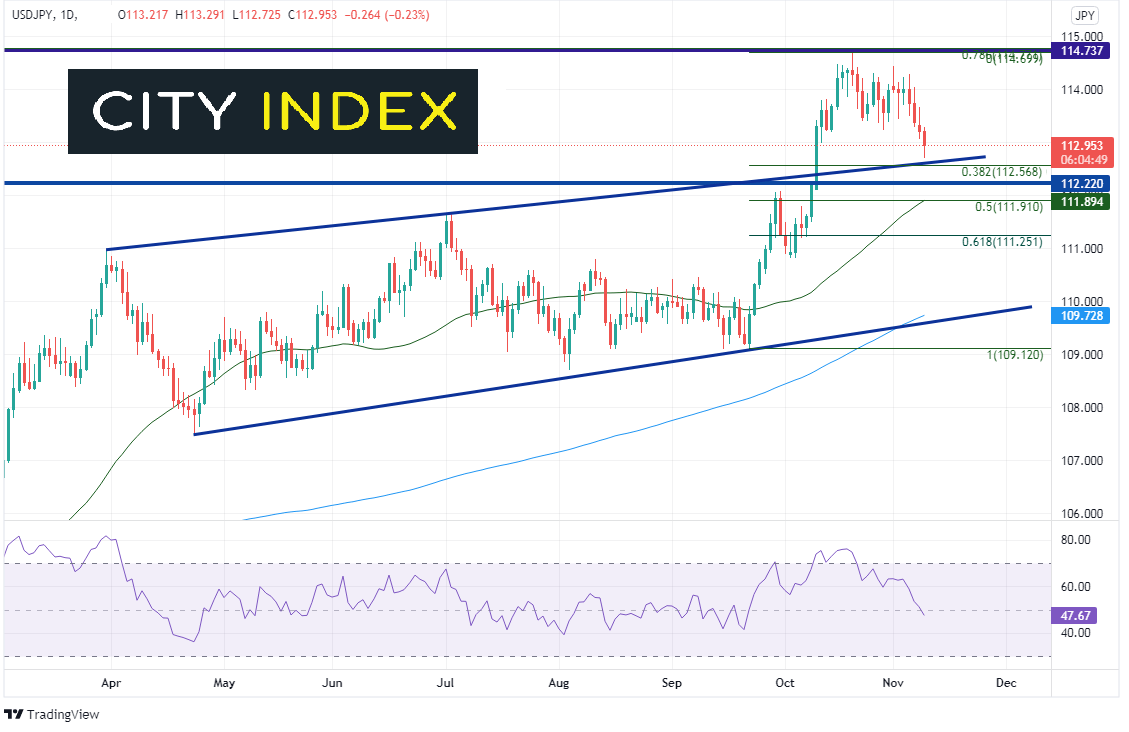
So that leads to the question “Where USD/JPY may be headed?”. USD/JPY has been moving higher off channel support at 109.12 since the September FOMC meeting and reached a high of 114.70 on October 20th, which was resistance dating back to 2017. On its move higher, the pair broke through horizontal resistance and the top trendline of the channel near 112.22. This level now acts as support. However, ahead of that is the top trendline of the channel and the 38.2% Fibonacci retracement level from the September 22nd lows to the October 20th highs, near 112.57. Below 112.22 is an additional confluence of support at the 50% retracement and the 50-Day Moving Average near 111.90. Short-term resistance is at todays highs (and the October 28th lows) at 113.29. Above there price can move up to the October 20th highs at 114.74.
Source: Tradingview, Stone X
If 10-year yields can hold support and move higher, USD/JPY may be able to do the same. If traders want to buy USD/JPY, it may be a question of timing regarding when rates will turn higher. With PPI at its strongest levels since November 2010 (although plateauing), and CPI expectations higher, traders may get their answer tomorrow.
Learn more about forex trading opportunities.
Latest market news
Yesterday 01:23 PM
Yesterday 06:01 AM
April 18, 2024 11:27 PM
April 18, 2024 04:46 PM
Latest Forex articles
Yesterday 06:01 AM
April 17, 2024 02:40 PM
April 17, 2024 04:47 AM