


January 12, 2022 2:51 PM
The US CPI for December was in-line with expectations of 7% vs November’s print of 6.8%. This is the highest reading since June 1982! The Core CPI, which strips out the volatile food and energy components of the data, was 5.5% vs 5.4% expected. November’s print was 4.9%! This is the highest reading for the core print since February 1991!
Forecasting 2022 inflation: Transitory no more?
Yesterday, at Fed Chairman Powell’s re-nomination hearing, the Fed Chairman said that the Fed will do whatever is necessary to contain inflation, including the possibility of tapering at a faster pace and increasing interest rates as long as necessary. He also acknowledged that the price pressures (inflation) will extend through the middle of this year. In addition, Powell said that that the Fed will begin shrinking the balance sheet soon after the first rate hike (2-4 meetings) and that it could shrink sooner and faster than last time (2018).
Central Banks: Liftoff in Focus?
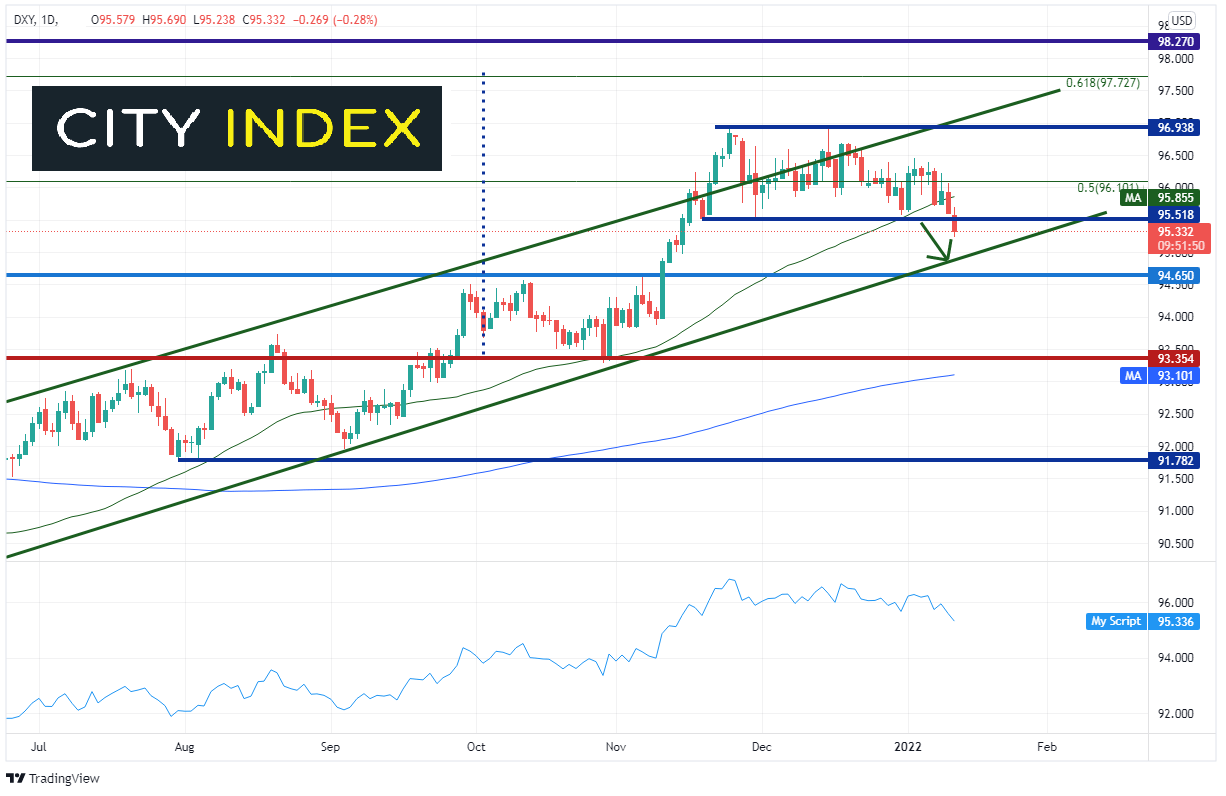
The 7-handle figure for the headline CPI was well anticipated by the markets heading into the number. Therefore, the risk was that the print would be lower to in-line. In a “buy the rumor, sell the fact” trade, the US Dollar sold off immediately following the print. But how much lower will the DXY move before it can reverse? The US Dollar Index finally broke below the horizontal range it had been in since mid-November 2021 between 95.50 and 97.00. However, it had been in a long-term upward sloping channel since May 2021. Watch for price to test the bottom trendline of the channel near 94.90. Horizontal support below there is at 95.65 , then 93.35. Resistance above is at the 50 Day Moving Average near 95.85, then top of the recent range at 96.94/97.00 and the top, upward sloping trendline of the channel near 97.15.
Source: Tradingview, Stone X
Trade the DXY now: Login or Open a new account!
• Open an account in the UK
• Open an account in Australia
• Open an account in Singapore
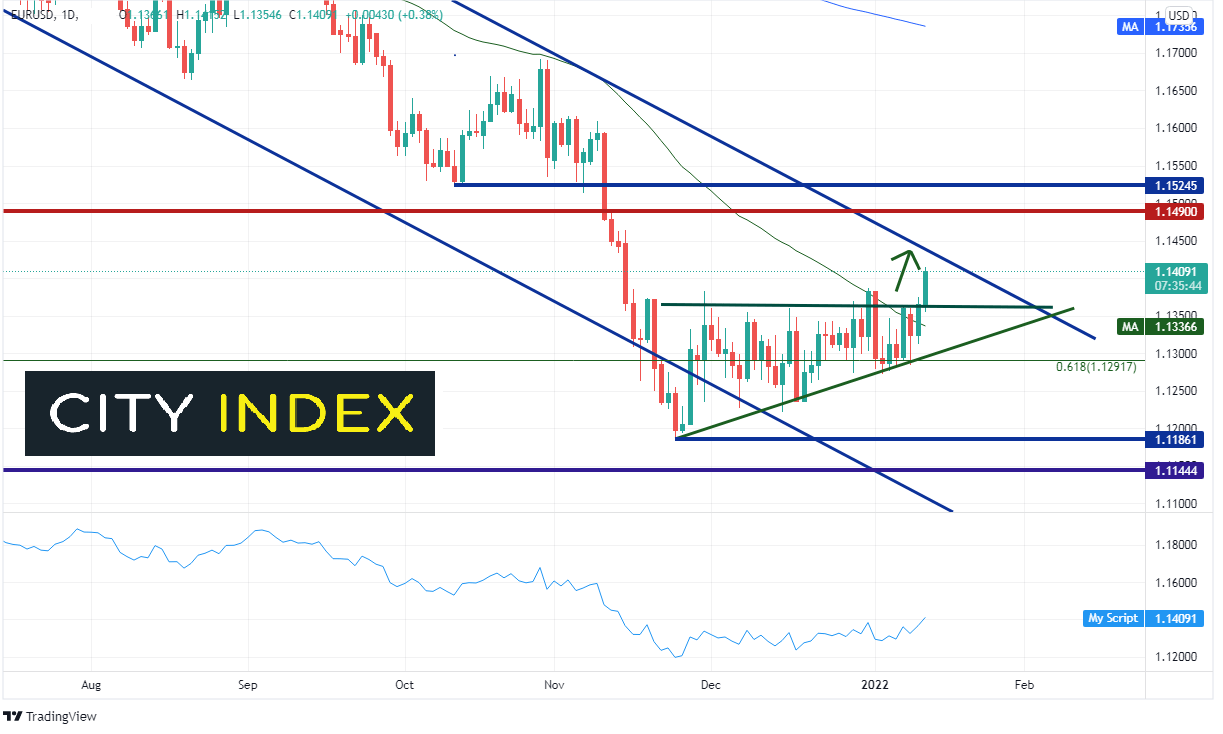
As EUR/USD makes up 58% of the DXY, one may expect that it would do the opposite of the US Dollar Index. Indeed, thus far today it has. The pair broke out of a rising triangle near 1.1370 and is moving towards the top downward sloping trendline of the long-term channel the pair has been in since May 2021. The trendline offers the first resistance level near 1.1435, ahead of long-term horizonal resistance at 1.1490/1.1500. More horizontal resistance is just above at 1.1525. Support below is at the 50 Day Moving Average at 1.1337, then the bottom, rising trendline of the rising triangle near 1.1290. If price breaks below there, it can fall to the November 25th, 2021 lows near 1.1186.
Source: Tradingview, Stone X
Trade EUR/USD now: Login or Open a new account!
• Open an account in the UK
• Open an account in Australia
• Open an account in Singapore
The US CPI printed 7%, its highest level in nearly 40 years! However, the 7-handle print was widely anticipated. Watch for the “buy the rumor, sell the fact” trade until the next catalyst, which could be PPI on Thursday or Retail Sales on Friday.
Learn more about forex trading opportunities.
Latest market news
Today 01:15 PM
Today 07:49 AM
Today 04:24 AM
Latest Forex articles

Today 04:24 AM
Yesterday 10:48 PM
Yesterday 12:00 PM