


June 25, 2021 11:49 AM
US Core PCE: Will it cause US Fed members to change their views?
US Core PCE is said to be the Fed’s favorite measure of inflation. As mentioned in our Preview, it is wide encompassing, as it covers all households and nonprofit institutions servicing households. Therefore, the Fed is said to favor this measure of inflation over others. Todays release of May Core PCE was 3.4% YoY vs 3.5% expected and 3.1% in April. This is the highest YoY reading in over 30 years! The headline print was 3.9% vs 4.2% expected and 3.6% in May. Recall that at the recent FOMC meeting, the “dot plots” showed that members expected 2 rate hikes by the end of 2023 and 7 members expected 1 rate hike by the end of 2022. In addition, Fed member Bullard said recently that Powell has opened the discussion on tapering. Although today’s Core PCE print was slightly weaker than expected, it is still a strong reading. Therefore, if this is really one of the Fed’s favorite measures of inflation, will today’s inflation print cause them to taper sooner than they would like? Fed members have been paraded out all week discussing how the high inflation is transitory. Some officials see inflation as more transitory than others. Today’s print shows that although inflation is strong, its not rampant. It will be interesting to see if Fed speakers change their tune as a result of today’s print.
Everything you need to know about the Federal Reserve
The EUR/USD immediately went bid as the US Dollar sold off. On a daily timeframe, the pair broke lower from the wedge formation on June 1st and pulled back to horizontal support at 1.1848, just below the 61.8% Fibonacci retracement level from the March 31st lows to the May 25th highs. The pair appears to be correcting higher in a flag-like formation. The target for a flag pattern is the length of the flag pole added to the breakdown point from the flag. In this case, the target is near 1.1710, which is also the target for the longer-term ascending wedge. Strong horizontal resistance is just above at 1.1989. In addition, the 50 Day Moving Average confluences with the horizontal resistance near that level at 1.1994.
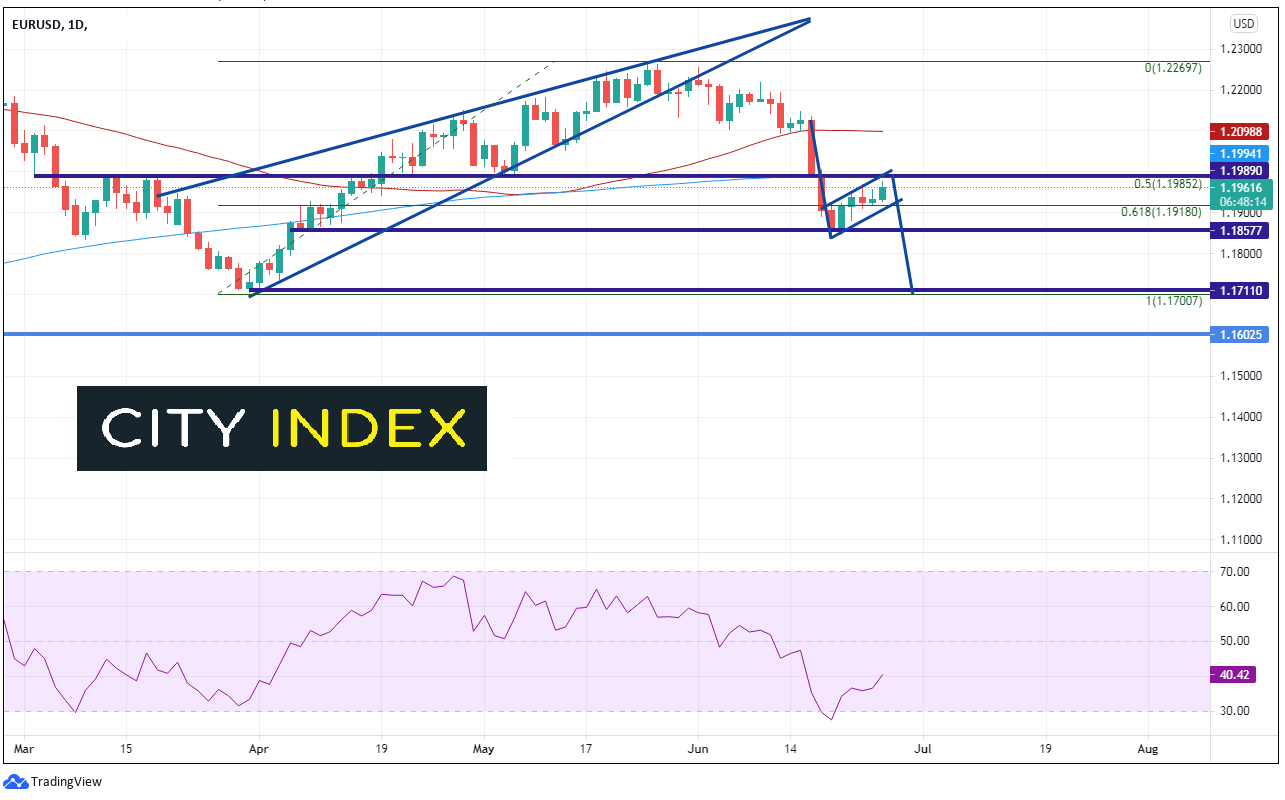
Source: Tradingview, City Index
On a shorter, 240-minute timeframe, there is additional resistance above at 1.2050. Support below is at the bottom trendline of the flag pattern near 1.900, then the lows of the flag near 1.1846. Horizontal support crosses ahead of the target near 1.1788.

Source: Tradingview, City Index
If today’s print causes Fed officials to speak less hawkish because it didn’t beat expectations, than EUR/USD could move higher above the flag resistance at 1.1985. However, if the strong print has Fed members leaning hawkish, we could see the US Dollar move higher and EUR/USD may be on its way to the flag and ascending wedge target near 1.1710.
Learn more about forex trading opportunities.
Latest market news
Today 11:14 AM
Today 08:28 AM
Yesterday 03:30 PM
Latest EUR articles
April 13, 2024 08:00 PM
March 25, 2024 02:55 AM
January 22, 2024 04:19 AM
January 18, 2024 04:46 AM